Which graph database should you choose? Which knowledge graph platform fits your use case? And where does GraphRAG fit in?
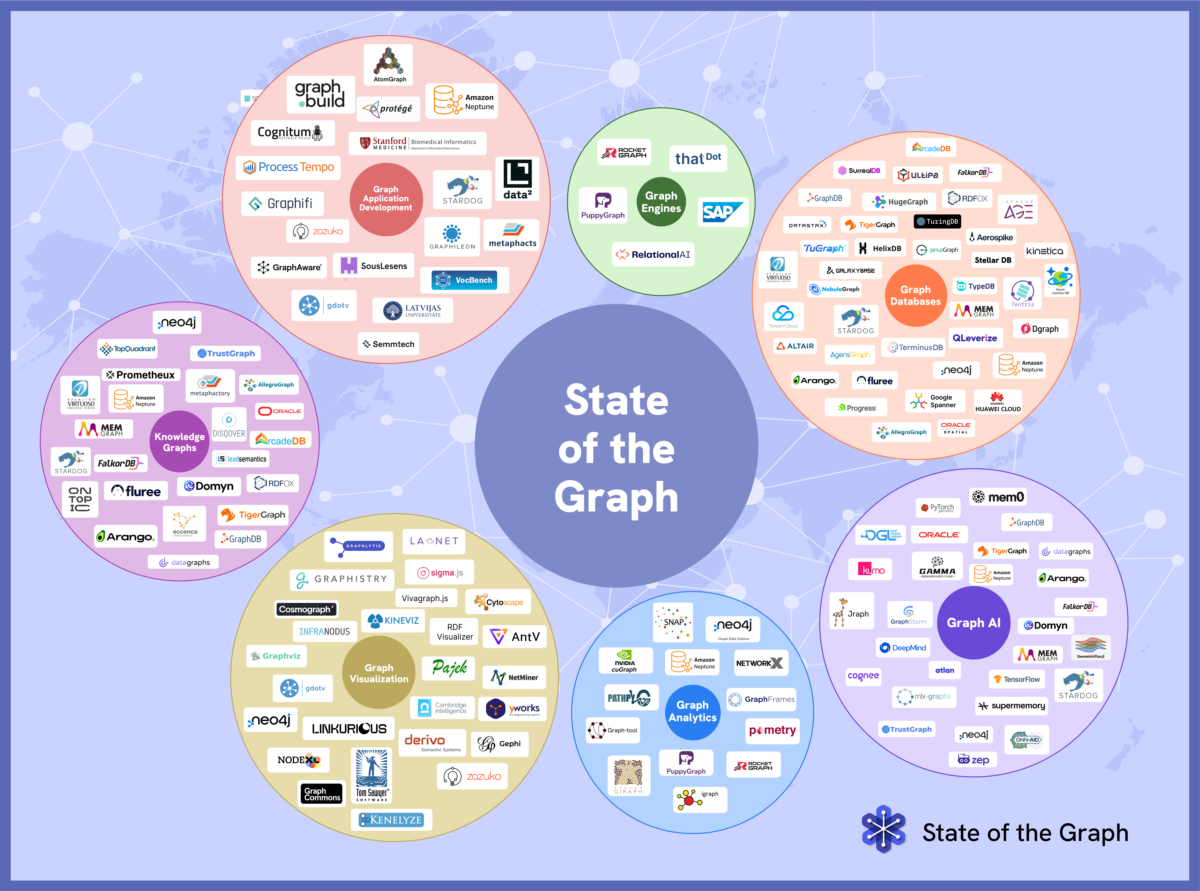
For seven months, we mapped the entire graph technology ecosystem – 7 categories, 128 products, 113 vendors – so you can answer all these questions and more.
The graph technology market size has grown exponentially in recent years. It will grow from $6.4 billion in 2025 to $7.81 billion in 2026 at a compound annual growth rate (CAGR) of 22% according to Research and Markets.
But until now, there was no single, objective source to understand who’s building what, and how it all connects.
Seven months ago, State of the Graph launched with a single goal: to produce a comprehensive, up-to-date, and vendor-neutral map of the graph technology ecosystem. Not a vendor ranking. Not an analyst quadrant. A map built from the ground up, category by category, product by product.
The first category, Graph Analytics, was published in February 2026. The seventh, Graph Application Development, was published in May 2026. The map is now complete.
Across 7 categories, the State of the Graph catalog has evaluated 128 unique products from 113 vendors, producing 156 catalog entries in total. The gap between 128 products and 156 entries is itself one of the most revealing findings: 20 products qualify for more than one category.
Not because the inclusion criteria are loose, but because the ecosystem is genuinely interconnected. A graph database can be a knowledge graph platform. A GraphRAG engine can serve as a memory layer. The map is designed to make those overlaps visible, not paper over them.
The data reveals a market that has outgrown its own categories. It is building new ones in real time.
Graph Databases
Explore all 40 Graph Databases in the catalog →
Graph databases are where graph theory becomes operational infrastructure. They store and query data natively as graphs, treating nodes and relationships as first-class citizens rather than rows and foreign keys.
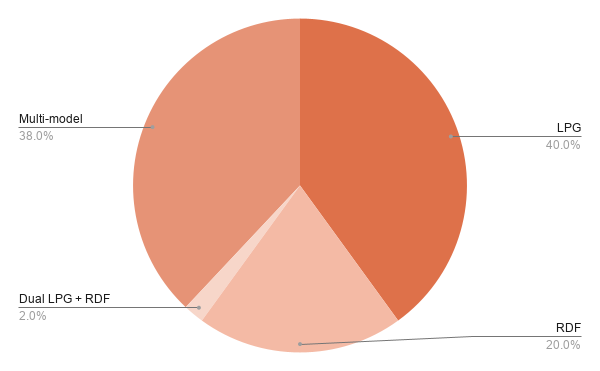
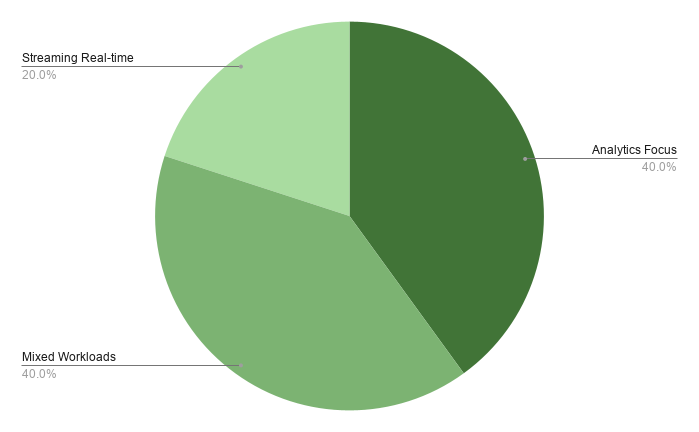
The 40 tools break down by graph model: 16 are pure LPG systems (40%), 15 are multi-model engines combining graph with relational, document, key-value, or vector storage (38%), 8 are pure RDF triple stores (20%), and 1 natively supports both LPG and RDF as first-class models (2%).
The most striking workload finding: 68% of graph databases listed serve mixed transactional and analytical workloads.
That is not a feature overlap. It is a market signal. The era of single-purpose graph databases built for one workload type is over. AI drove that shift. The catalog reflects it.
Five are hyperscaler-managed services. Nearly half (48%) have an open-source option available. The choice of graph model shapes everything that follows in the stack, which makes this the most consequential continent to understand before evaluating anything else. Read the deep dive →
Knowledge Graphs
Explore all 25 Knowledge Graph platforms in the catalog →
Knowledge graphs turn connected data into governed, machine-readable domain knowledge. They add schema, lineage, data quality, and organizational context to the raw graph model, defining what entities are, how they relate, and what can be trusted about them.
A knowledge graph is not defined by its underlying storage paradigm. The State of the Graph catalog includes knowledge graphs built on LPG and RDF stores, as well as converged systems that support both. What defines a knowledge graph is what it does, not how it stores data.
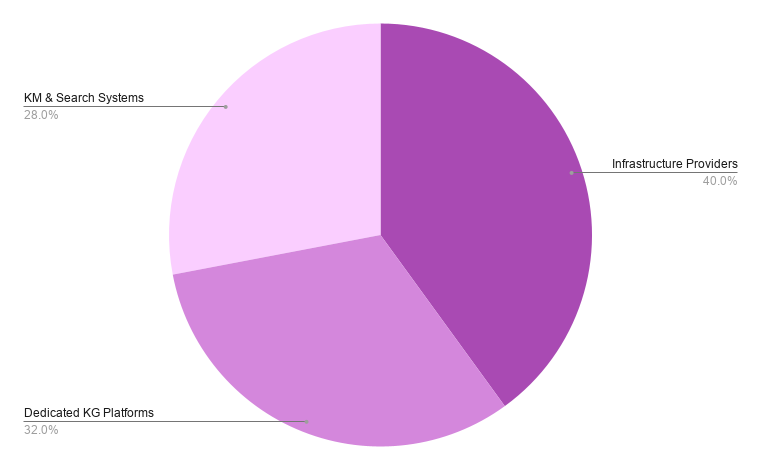
The 25 tools break into three platform types. Ten are general-purpose graph databases or infrastructure providers with strong knowledge graph positioning (40%), including ArangoDB, Neo4j, Memgraph, TigerGraph, and FalkorDB. Eight are dedicated knowledge graph platforms purpose-built for this use case (32%), including AllegroGraph, GraphDB, RDFox, Stardog, and TopQuadrant. Seven are knowledge management and search systems at the application layer (28%), including Domyn, DISQOVER, and metaphactory.
The most significant finding in the Knowledge Graph continent: several vendors appear in both Knowledge Graphs and GraphAI.
That overlap is not accidental. Knowledge graphs are increasingly the context layer that GraphRAG systems retrieve from. That means the boundary between the knowledge graph continent and the GraphAI continent is the most active frontier on the map. Read the deep dive →
Graph Analytics
Explore all 13 Graph Analytics tools in the catalog →
Graph analytics tools use graph algorithms to uncover patterns, measure structural properties, and extract insight from connected data. This continent covers the libraries, frameworks, and platforms that make graph computation available as a distinct analytics capability, separate from the databases that store the data.
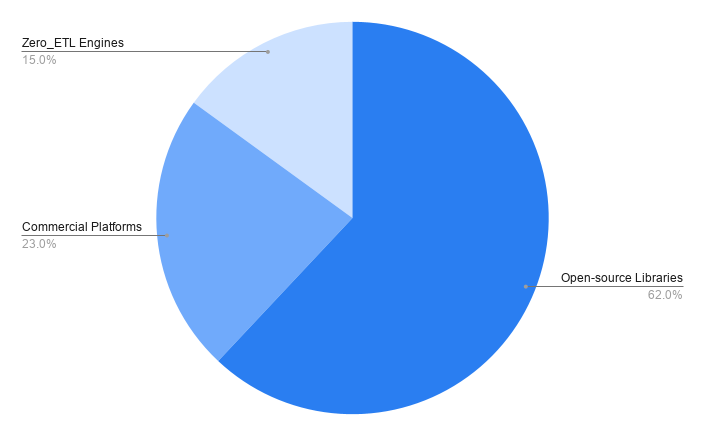
The 13 tools fall into three groups: 8 open-source libraries (62%), the backbone of the category, including NetworkX, igraph, Stanford SNAP, Nvidia cuGraph, and graph-tool; 3 commercial or managed platforms (23%), including Amazon Neptune Analytics, Neo4j Graph Data Science, and Pometry; and 2 zero-ETL graph analytics engines (15%), PuppyGraph and Rocketgraph xGT.
The dominance of open-source reflects the fact that practitioners typically assemble Graph Analytics solutions rather than buy as a packaged product.
Graph Analytics is the second-smallest continent in terms of tool count, not because the category is immature, but because the inclusion criteria are precise. Analytics must be a distinct, first-class offering, not a feature buried inside a database. Read the deep dive →
Graph Engines
Explore all 5 Graph Engines in the catalog →
Graph engines add graph-shaped computation on top of existing data systems: relational databases, data warehouses, and event streams, without replacing them as the system of record. No ETL. No separate graph store to manage. The graph is a computational layer projected onto the data it already lives on.
Graph Engines is the smallest continent on the map, and one of the most consequential.
For enterprises that cannot or will not move data into a new system, which describes the majority of large enterprises with established data infrastructure, graph engines offer a path to graph reasoning without architectural disruption. That proposition is becoming more relevant, not less, as AI increases the demand for relationship-aware computation across existing data estates.
The five entries, PuppyGraph, Quine, RelationalAI, Rocketgraph, and SAP HANA Graph, each represent a distinct architectural approach to the same core idea: graph reasoning on the data you already have. The catalog is deliberately small because the inclusion bar is precise: no primary graph storage, a programmable graph engine interface, and a documented deployment path. Read the deep dive →
Graph Visualization
Explore all 27 Graph Visualization tools in the catalog →
Graph visualization tools render connected data visually, helping users explore structure, identify patterns, and navigate complexity that tables and charts cannot capture.
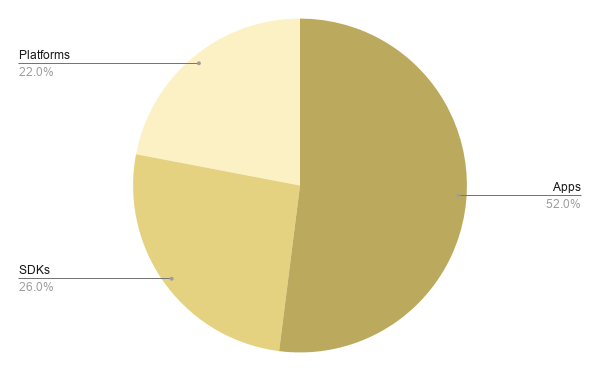
The 27 tools span three product types: 14 focused apps for analysts and researchers (52%), including Cosmograph, gdotv, Gephi, and Neo4j Bloom; 7 SDKs and libraries for developers embedding graph rendering into their own applications (26%), including AntV G6, Cambridge Intelligence, Sigma.js, and yWorks; and 6 build-on platforms for enterprise investigative and analytical workflows (22%), including Graphistry, Kineviz, and Linkurious.
Graph visualization is the most commercially-oriented category: 63% of tools are commercial, compared to 30% open-source.
The majority (67%) work with any graph data source regardless of the underlying model, a sign that visualization has matured into a horizontal capability rather than a database-specific feature.
One gap stands out in the data: only 10 of 27 tools include collaboration or sharing features. As graph exploration becomes a team activity in enterprise settings, analysts, data engineers, and business stakeholders working from the same graph will find that gap harder to ignore. Read the deep dive →
Graph Application Development
Explore all 18 Graph Application Development tools in the catalog →
Most graph projects do not fail at the database layer. They fail because there is no good way to turn the graph into something people can use. Graph Application Development is the continent that covers that gap: the tools that sit between the graph store and the end user.
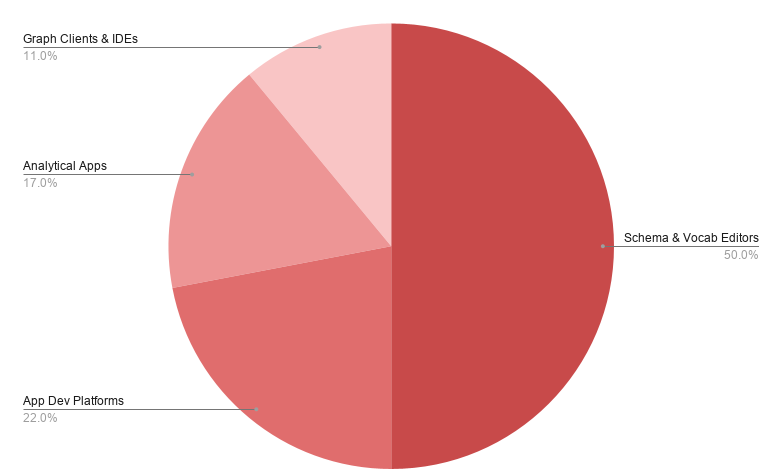
The 18 tools cover four types. Schema and vocabulary editors are the largest group at 9 tools (50%), collaborative environments for defining, maintaining, and governing graph data models at scale, including metaphactory, Protégé, Stardog Designer, and VocBench,. Graph app development platforms (4 tools, 22%) provide environments for building and operating applications on top of graph stores: EasyGraph, Graph.Build, Graphileon, and LinkedDataHub.
Graph-powered analytical applications (3 tools, 17%) deliver opinionated, domain-specific environments built on graph data: Hume, Process Tempo, and reView. Graph clients and IDEs (2 tools, 11%) serve developers and data engineers with querying, debugging, and result visualization: gdotv and Graph Explorer.
Low-code is the most common accessibility pattern (39%). That figure points to something important: the graph application development market is being pulled toward broader enterprise audiences, not just graph specialists.
The tooling is following the demand. Read the deep dive →
GraphAI
Explore all 28 GraphAI tools in the catalog →
GraphAI is the frontier continent: systems in which graph structure plays an active role in AI, not just as infrastructure but as a core mechanism shaping what is retrieved, remembered, or learned.
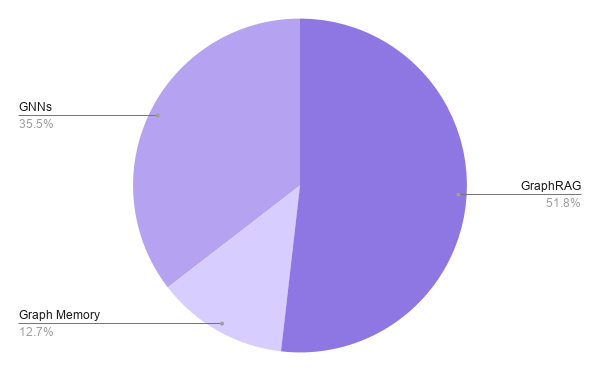
The 28 tools are organized into three structurally distinct types. GraphRAG covers 16 platforms that place a graph in the retrieval path for large language models, giving LLMs grounded, structured context from connected data, including Amazon Neptune, ArangoDB, FalkorDB, GraphDB, Memgraph, Neo4j, Stardog, TigerGraph, and others. All 16 support multiple LLM providers, a sign that the GraphRAG layer is maturing toward interoperability rather than vendor lock-in.
Graph Memory spans 4 platforms in which graph structure is the core architecture of agent memory, making long-term behavior persistent, queryable, and inspectable: Cognee, Neo4j, Trustgraph, and Zep.
Graph Memory is the smallest subcategory by tool count and the one most likely to look dramatically different in the near term.
The problem graph memory solves, agents that can reason across sessions rather than just within them, is becoming an enterprise requirement faster than the tooling is maturing.
GNNs cover 11 libraries and platforms where graphs serve as native training input for machine learning: Deep Graph Library, GraphStorm, Kumo, PyTorch Geometric, and TensorFlow GNN. The GNN layer is overwhelmingly open-source (10 of 11 tools), whereas GraphRAG skews toward the commercial side. That divergence reflects two distinct adoption patterns: GNNs are assembled by practitioners, whereas GraphRAG is increasingly purchased by enterprises.
GraphAI is the fastest-moving continent on the map. The expectation is not minor additions over time. The expectation is structural change. Read the deep dive →
The Numbers
128 unique products. 113 vendors. 156 catalog entries across seven categories.
| Continent | Active Tools |
| Graph Databases | 40 |
| Knowledge Graphs | 25 |
| Graph Analytics | 13 |
| Graph Engines | 5 |
| Graph Visualization | 27 |
| Graph Application Development | 18 |
| GraphAI | 28 |
| Total Unique Products | 128 |
How the Continents Connect
The seven categories are not independent layers stacked in sequence. They form a network. Fitting for a map of graph technology.
Graph Databases and Graph Engines are the foundational layer: where graph data lives or is projected from. Graph Databases provide primary graph storage with full transactional capabilities. Graph Engines add graph reasoning on top of existing data stores without replacing them.
Knowledge Graphs and Graph Analytics are the applied layer: where graph data is put to work. Knowledge Graphs turn connected data into governed, machine-readable domain knowledge. Graph Analytics applies algorithms to find patterns, measure structural properties, and detect communities across the connected data.
Graph Visualization and Graph Application Development are the interface layer: where graphs become usable by people. Visualization makes graph structure legible and explorable. Graph Application Development provides the environments needed to turn graph data into products that reach end users.
GraphAI is the frontier: where graph structure becomes part of how AI systems retrieve, remember, and learn. It draws from every other continent. A GraphRAG system needs a graph database or knowledge graph as its context layer. A graph memory layer needs application development tooling to surface its reasoning traces. That dependency structure is why the map needed all seven continents to be meaningful.
The 20 products that qualify for more than one category are the most important data points on the map. They show where the continents are structurally connected and where the next wave of consolidation is most likely to happen. Knowledge Graphs and GraphAI share the most overlap. The next highest overlap is between Graph Databases and Knowledge Graphs. Watch those boundaries. That is where the ecosystem is moving.
What Comes Next
The map is complete. The work of maintaining it begins now.
But complete is a relative term in a market moving this fast. The catalog reflects the ecosystem as it stood at the time of each publication. New tools are qualifying. Category boundaries are shifting. Architectural patterns that did not exist twelve months ago are becoming enterprise requirements.
This is not a market that is settling. It is a market that is accelerating, adding tools, blurring category boundaries, and generating new architectural patterns faster than any single catalog can fully capture. State of the Graph exists to keep pace with that movement, not just document where things stood at a point in time.
The graph technology ecosystem is alive, structurally complex, and moving faster than most enterprises realize. Seven months of mapping have made one thing clear: the most interesting developments are still ahead.
Join the mailing list for map updates, survey results, and ecosystem signals at stateofthegraph.com.

Leave a Reply