Most graph projects don’t fail because of the graph back end. They fail because there’s no good way to turn the graph into something people can use. Graph Application Development is the layer that bridges that gap.
Graph Application Development is the layer where application experiences are designed, assembled, and operated, turning graph platforms into usable tools. It covers the clients, builders, analytical workspaces, and ontology editors that sit above storage and engines and translate graph structure into everyday workflows, investigations, products, and semantic layers.
In this catalog, we focus on tools whose primary job is to help you build, explore, or operate applications powered by graphs.
Sometimes that looks like a multi back end graph IDE. Sometimes it is a low code builder for graph backed internal tools. Sometimes it is an investigative environment where graph is the organizing principle for analysis. And sometimes it is an ontology or taxonomy workbench where teams model the RDF, OWL, and SKOS structures that those applications rely on.
What ties them together is that they treat the graph platform as their foundation, not as something they are trying to replace.
The result is a map of the application layer in the graph ecosystem, a space that has often been scattered across internal consoles, vendor specific interfaces, ontology projects, and one off tools.
Who This Continent Is For
We focused on tools that matter in practice for:
- Developers and data engineers who want a home base for writing queries, testing models, wiring up workflows, and working across multiple graph back ends.
- Analysts, investigators, and business users who need applications built on top of graph data, for example insight workbenches, intelligence analysis environments, or graph powered dashboards.
- Knowledge engineers, ontologists, data modelers, and domain experts who configure and maintain knowledge graphs, ontologies, and RDF based systems, and want to expose them through configurable applications and semantic layers.
The catalog deliberately leaves out:
- General purpose graph databases that only ship a basic console or admin interface.
- One off internal tools with no clear product or reuse story.
- Generic business intelligence tools that treat graph as just another datasource with a single network chart buried among many.
Everything here is either a graph client or IDE, an application development platform, a graph powered analytical application, or an ontology and taxonomy editor that you can actually adopt.
How We Drew the Map: Inclusion Criteria
To qualify for the Graph Application Development catalog, a product had to meet three conditions.
Graph-native application layer
The tool must understand graph data models natively (nodes, edges, properties, RDF triples) and speak graph query languages as a first-class capability. It does not replace the underlying graph store as the system of record. This is what distinguishes graph app development tools from generic low-code platforms that happen to support a graph connector.
Durable application environment
The product has to support repeatable use as an application, investigative environment, or semantic modeling workspace, not just one off visualizations or demos. In practice, that means:
- You can define queries, views, models, or flows that people will come back to.
- Teams use it to do ongoing work such as debugging, building internal apps, running investigations, reviewing decisions, or curating ontologies and taxonomies.
- The reason teams adopt it is that it lets them ship or operate a solution, or manage the semantic layer behind those solutions, not only because it can show a graph once.
Pure viewers, thin admin consoles, or helpers that only offer a single static screen did not make the cut.
Clear deployment model and supported back ends
We require a documented answer to both how the tool is deployed and what it connects to:
- Deployment options such as software as a service, cloud, on premises, self hosted, desktop, containerized, or hybrid should be explicit.
- Supported graph databases or semantic platforms should be named, not implied.
- There should be enough operational detail that an architect could realistically plan to introduce the tool into an existing environment.
This makes the catalog useful when you have constraints like needing to run in your own virtual private cloud or already running several graph databases and wanting a single application and semantic layer above them.
The Main Landmasses: Clients, Builders, Analytical Applications, and Ontology Editors
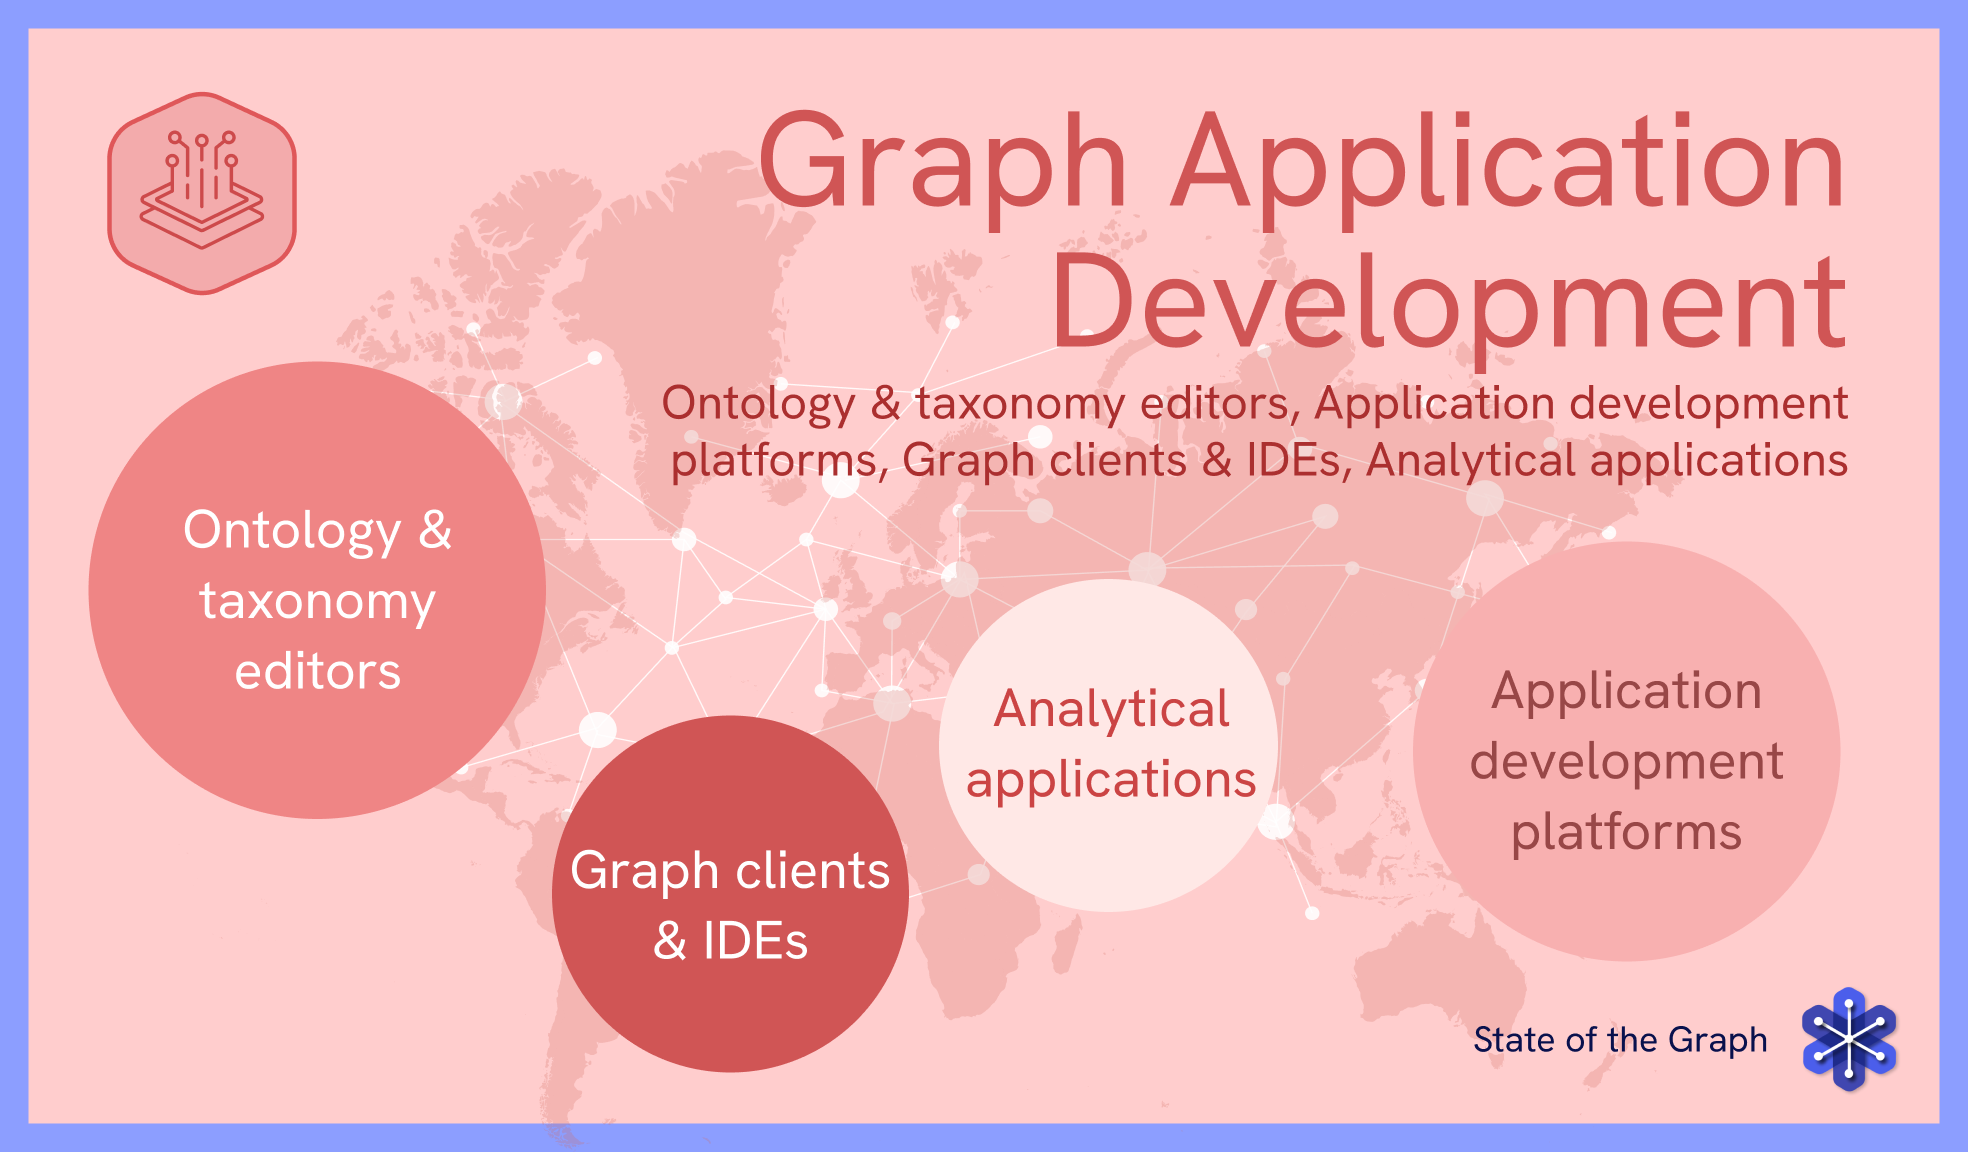
Just as the graph visualization catalog clustered into platforms, desktop tools, and libraries, Graph Application Development tools naturally group into four broad landmasses.
Graph clients and IDEs: home base for developers
These tools act as graph workbenches.
- They provide editors, completion, result views, and often multi database connectivity for working with queries and data.
- Examples in this vein include tools like G.V() and the Graph Explorer for Neptune, which developers and data engineers use day to day for querying, debugging, and exploratory analysis.
- They tend to be pro code. You interact primarily through Cypher, SPARQL, Gremlin, SQL based graph extensions, or other query languages, with visualizations and inspectors built around those queries.
If you are a developer or engineer living close to the database, this is likely the region you spend most of your time in.
Application development platforms: visual builders on graph
A second cluster is low code and no code platforms built specifically to assemble applications on top of graph databases.
- Tools like Graph Build, Graphileon, EasyGraph, and LinkedDataHub provide visual builders, configuration driven modeling, and often workflow capabilities.
- They connect to one or more graph back ends, offer user interface components and application logic, and let you define graph backed apps without building everything from scratch.
- Interaction styles often fall into no code or low code, using configuration, forms, and visual modeling, with optional scripting or query editing for advanced users.
These are the tools that help teams go from having a graph to having an internal tool or user facing application built on that graph.
Graph powered analytical and investigative applications
The third landmass is opinionated applications where graph sits at the heart of analytical workflows.
- Examples include products like Hume, Process Tempo, and reView, which bring graph native analysis into domains such as intelligence, risk, security, and regulated industries.
- They combine graph data, workflows, visualization, and domain specific features into complete environments that analysts can use day after day.
- They integrate with graph databases behind the scenes, but what users see is an investigative or analytical workspace, not a generic builder.
If you are building an analytical practice around graph rather than a generic internal tool, this is the territory you will care about most.
Ontology and taxonomy editors: shaping the semantic layer
The fourth landmass is ontology and taxonomy tooling that defines the semantic structures applications run on.
- Tools like VocBench, metaphactory, SousLesensVocables, WebProtégé, and Zazuko Ontology Manager provide collaborative environments for modeling RDF, OWL, and SKOS, managing vocabularies, and governing knowledge graph schemas.
- They focus on ontology modeling, taxonomy management, schema and model design, and knowledge graph schema governance rather than on end user dashboards or pipeline orchestration.
- In many organizations these tools are the place where knowledge engineers, ontologists, and domain experts work every day, long before a graph backed application ever reaches production.
If you are building or governing a semantic layer on top of graph databases, this is the part of the map you will keep coming back to.
What This First Version Tells Us
Looking across the initial entries, several patterns are already apparent.
Specialization by audience and interaction style
The no code, low code, and pro code lens makes clear that the category splits by who each tool really serves.
- Developer first clients cluster firmly in pro code.
- Application development platforms mix no code and low code, catering to technical users who do not necessarily want to live in query editors.
- Analytical applications usually sit in low code, giving analysts powerful controls and configuration surfaces without requiring them to be database experts.
This matters when you are matching tools to teams with very different skill sets.
Property graphs and RDF both have real application ecosystems
The catalog shows RDF focused tools alongside LPG centric ones, including ontology and taxonomy editors that manage OWL and SKOS vocabularies as first class application assets.
Multi database workbenches are emerging as their own pattern
Some tools are plainly tied to a single vendor’s database. Others are deliberately built as multi database IDEs that sit above a variety of graph back ends. As more organizations end up with multiple graph technologies, these vendor neutral clients become a distinct and important pattern.
Analytical applications blur into graph AI and analytics
Graph powered analytical environments inevitably brush up against graph analytics and graph AI. They incorporate scoring, pattern detection, and in some cases graph enhanced retrieval or explainable AI. The catalog draws the line at reusable applications built on top of graph platforms, while deeper AI and graph neural network stacks are captured separately in the Graph AI category.
How Graph Application Development Fits into State of the Graph
Graph Application Development is one part of the broader State of the Graph landscape, which also surveys graph databases, graph engines, graph analytics, graph visualization, graph AI, and knowledge graphs. Each category has its own definition and inclusion criteria, but together they reflect how practitioners actually reason about graph systems.
- Graph databases handle persistence and core query execution.
- Graph engines run graph computation over existing systems without becoming a new store.
- Graph application development tools give people the means to build and operate applications on top of those layers.
- Graph visualization focuses on how graphs are made explorable and communicable.
- Graph AI and analytics bring generative AI and advanced models into the picture.
Thinking in these layers helps clarify where you are strong today, where you need more capability, and which products fill which roles.
Help Us Improve the Graph Application Development Map
This is a first round map of the Graph Application Development continent, and it will evolve. Some tools will move as their capabilities grow. New entrants will appear, and some existing offerings may shift closer to adjacent categories like graph AI or analytics as they add features.
Your experience is what will make this genuinely useful.
- Which graph application tools are you running in production today.
- Which clients, builders, or analytical workspaces are missing under the current criteria.
- Where we misread the main user, interaction style, or deployment realities.
- What additional attributes would help you compare and choose among tools in this layer.
If you are designing, implementing, or operating graph-centric systems, or building products in this space, your feedback on this first version will help sharpen the map.
Explore the Graph Application Development catalog and tell us what to add, adjust, or clarify. Your input will guide the next iteration of this category and strengthen the broader State of the Graph map.

Leave a Reply