Graphs are how we see structure in messy, connected data: people and their relationships, systems and dependencies, concepts and citations.
The landscape of graph visualization tooling is sprawling, ranging from ready‑to‑use graph apps and platforms to tiny JavaScript libraries you can drop into a single page.
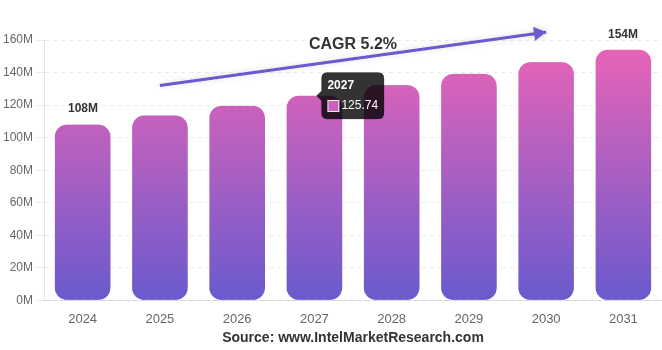
The global data visualization tools market size was valued at USD 9.22 billion in 2022 and is projected to reach USD 22.12 billion by 2030, growing at a CAGR of 11.4% from 2023 to 2030 according to Grand View Research. Graph Visualization is an emerging market valued at USD 108 million in 2024. The market is projected to grow from USD 114 million in 2025 to USD 164 million by 2032, exhibiting a CAGR of 5.2% during the forecast period according to Intel Market Research.
The State of the Graph catalog of Graph Visualization focuses on tools whose purpose is interactive network and graph visualization, not generic dashboards that happen to show a few nodes and links.
Each row describes what the product is, who it is for, how it connects to data, and how far you can go with analysis and embedding. The result is a navigable map of a space that has historically been confusing to buyers and practitioners.
Who This Is For
We focused on tools that matter in practice for:
- Analysts and investigators who spend their days following relationships: fraud rings, cyber campaigns, supply chains.
- Developers and architects who need reliable building blocks, SDKs and libraries to add graph views to their own applications.
- Researchers and data scientists who run network experiments and prototype models, and need fast visual feedback on complex structures.
The catalog deliberately excludes “nice to have” graph views buried in admin consoles or single-vendor user interfaces. Everything included is either a ready‑to‑use app, a platform, or an embeddable library or SDK you can pick up and use in your own stack.
👉 How We Drew the Map: Inclusion Criteria
To make it into the Graph Viz catalog, a product had to clear three bars:
Graph/network first
The tool’s core purpose includes interactive graph or network visualizations: nodes, edges, and layouts that reveal connectivity. Generic BI charting libraries or dashboards without real network views are out of scope.
Standalone app, platform, or library/SDK
Each entry is either an app, a platform, or a reusable library or SDK you can embed in applications. We do not list internal graph consoles that ship only as part of a single vendor’s admin interface, with no standalone developer story.
Actively maintained or widely used
The tools are either actively updated (recent releases, docs, or vendor activity) or, in the case of older ecosystems like Gephi, Cytoscape, or Pajek, still widely used and relevant in 2026.
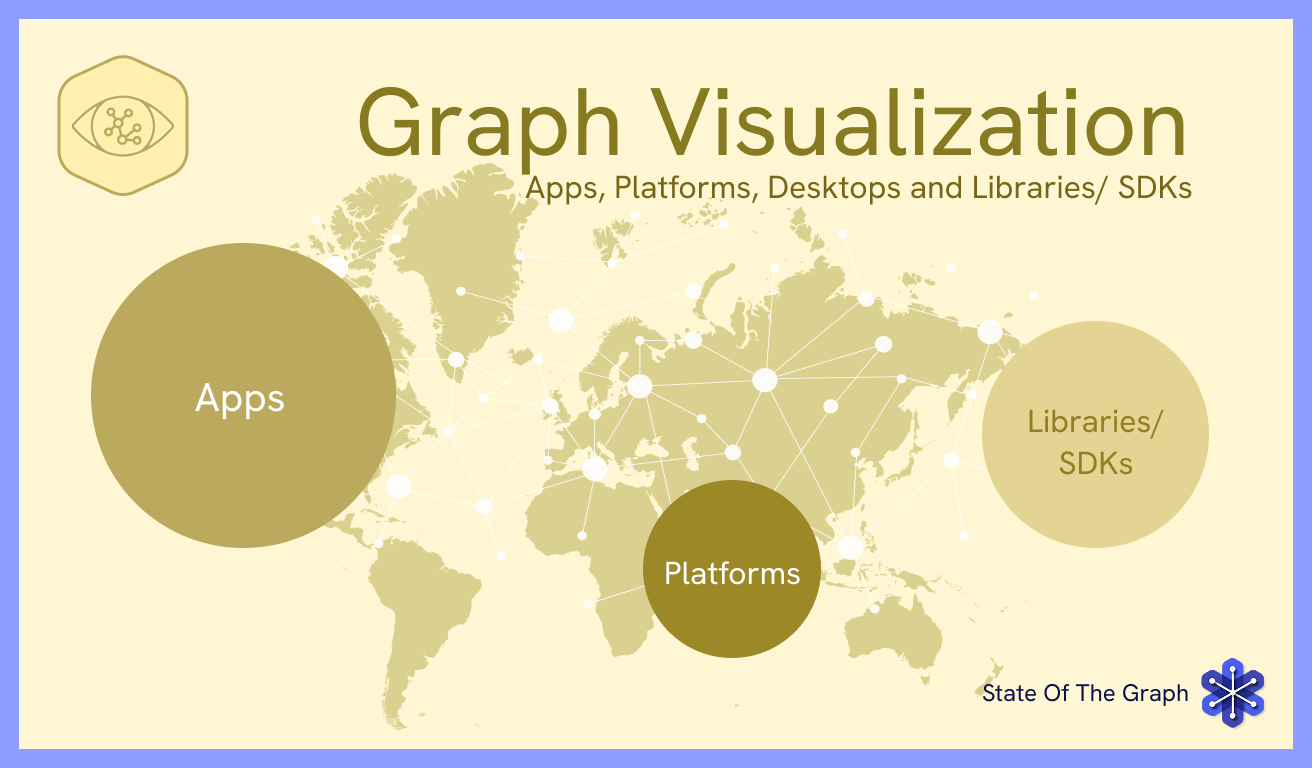
👉 The Main Landmasses: Apps, Platforms, and Libraries
Graph visualization tools tend to cluster into three big “landmasses” on this continent:
Apps: Graph tools for analysts, researchers, and operators
These products ship ready‑to‑use applications for exploring and analyzing graphs. Examples include G.V(), Graphlytic, Graph Commons, InfraNodus, Neo4j Bloom, SemSpect, RDF Visualiser, and Graph Explorer, along with desktop tools such as Gephi, Cytoscape, Pajek, NetMiner, LaNet‑vi, and NodeXL.
They connect directly to graph databases, relational stores, search engines, SPARQL endpoints, or APIs, often supporting multiple backends per tool. Most offer rich layouts (force‑directed, hierarchical, geo, time‑based) and advanced analytics (centrality, communities, pattern queries) with high interaction depth: filtering, expansion, timelines, dashboards, and saved views.
These are the tools you hand to investigators, operations teams, or knowledge‑graph users who want to explore data without writing code.
Platforms: Graph app builders and low-code environments
A second cluster is graph platforms: products that go beyond a single end-user application and help teams build or configure graph-centered experiences of their own. Graphileon, Graphistry, Kineviz GraphXR, Linkurious, and Tom Sawyer are the clearest examples in this version of the catalog.
They combine graph visualization with low-code app building, dashboarding, and SDK capabilities, making them useful when the goal is not just to explore a graph, but to create reusable graph-driven interfaces for other users.
Libraries and SDKs: Building Blocks for Your Own Use Cases
The third landmass is developer‑focused. AntV G6, Cytoscape.js, Sigma.js, VivaGraph, Graphviz, yFiles, and the Cambridge Intelligence SDKs are libraries or SDKs rather than end-user applications, even when they ship with designer- or platform-style components.
Data models are usually generic: they accept any node/edge structures and leave semantics to your application. In exchange, they give you fine‑grained control over rendering, interaction, and styling so you can build bespoke graph UIs.
If you’re building your own product and just need a graph visualization component, this is the region you’ll mostly live in.
👉 What This First Version Tells Us
Even in this first iteration, several patterns stand out across the graph visualization landscape.
Three clusters instead of one dominant stack
We don’t see a single “winner takes all” stack. Instead, the ecosystem splits into:
- Ready‑to‑use apps that focus on multi‑source connectivity, visual analytics, and investigative workflows.
- Platforms that support building and configuring graph-centered applications and dashboards.
- Developer‑centric libraries that export graph canvases as components, leaving data modeling and UX to the host app.
This diversity is good news: it means you can choose a tool that matches where you sit, from business analyst to front‑end engineer.
From “viewer” to “analysis environment”
The combination of Built‑in Analytics and Interaction Depth surfaces a spectrum:
- At one end, pure rendering libraries with no analytics and basic interaction.
- In the middle, tools with basic metrics and search/filter capabilities suitable for many monitoring and operations scenarios.
- At the high end, apps and platforms with advanced analytics and rich interaction effectively serve as full investigative environments on top of graphs.
This helps separate tools that simply “draw” graphs from those designed to drive real analytical workflows.
Embeddability and deployment shape how tools are used
How a tool is embedded and deployed heavily influences where it fits:
- JS libraries and SDKs are naturally pulled into product teams’ codebases.
- SaaS and hybrid apps and platforms slot into data and analytics stacks, especially where multiple teams share graph views.
- Desktop‑only tools remain the workhorses of research and ad‑hoc analysis.
These differences matter when you’re deciding whether to stand up a new system or instrument an existing one with graph views.
👉 How Graph Visualization Fits into State of the Graph
Graph Visualization is one part of the broader State of the Graph landscape, which also examines:
- Graph databases
- Graph engines
- Graph analytics
- Graph visualization
- Graph application development
- Graph AI
- Knowledge graphs
Across these categories, the common thread is a structured, comparative view of offerings, framed in terms that match how practitioners actually evaluate and use graph technology. The Graph Visualization catalog extends that lens to the visual interface layer, the tools people actually use when they explore or communicate graphs.
Graph Visualization focuses on how those structures are made visible and explorable: layouts, scale, interaction, analytics, and embeddability. Taken together with the other State of the Graph categories, they show both the brains of graph systems, models & reasoning, and the eyes, how humans see and work with the graph
👉 Help Improve the Graph Visualization Map
This is a first‑round map of the graph visualization “continent,” and it will evolve. Some boundaries between categories will stay blurry. There may be tools we haven’t added yet, and capabilities that will grow or shift as vendors expand their offerings.
Your experience is what will make this useful:
- Which graph visualization tools are you using today in production, research, or product development?
- Which platforms or libraries are missing under the current criteria?
- Where did we misjudge scale, analytics depth, or embeddability?
- How should we refine the way we group and describe these offerings?
If you’re designing, implementing, or operating graph‑centric systems, or building visualization tools in this space, we’d love your feedback on this first version.
Explore the Graph Visualization catalog and tell us what to add, adjust, or clarify. Your input will guide and strengthen the next iteration of this category and the broader State of the Graph.
Leave a Reply