State of the Graph 2026 v.2.0 is LIVE!
What changed in graph technology in the last months? Where are AI agents pulling the ecosystem? And which parts of the map are still blank?
In June, State of the Graph completed its first map of the graph technology ecosystem: seven continents, built category by category, product by product. Version 2 is live today, and the map has moved.
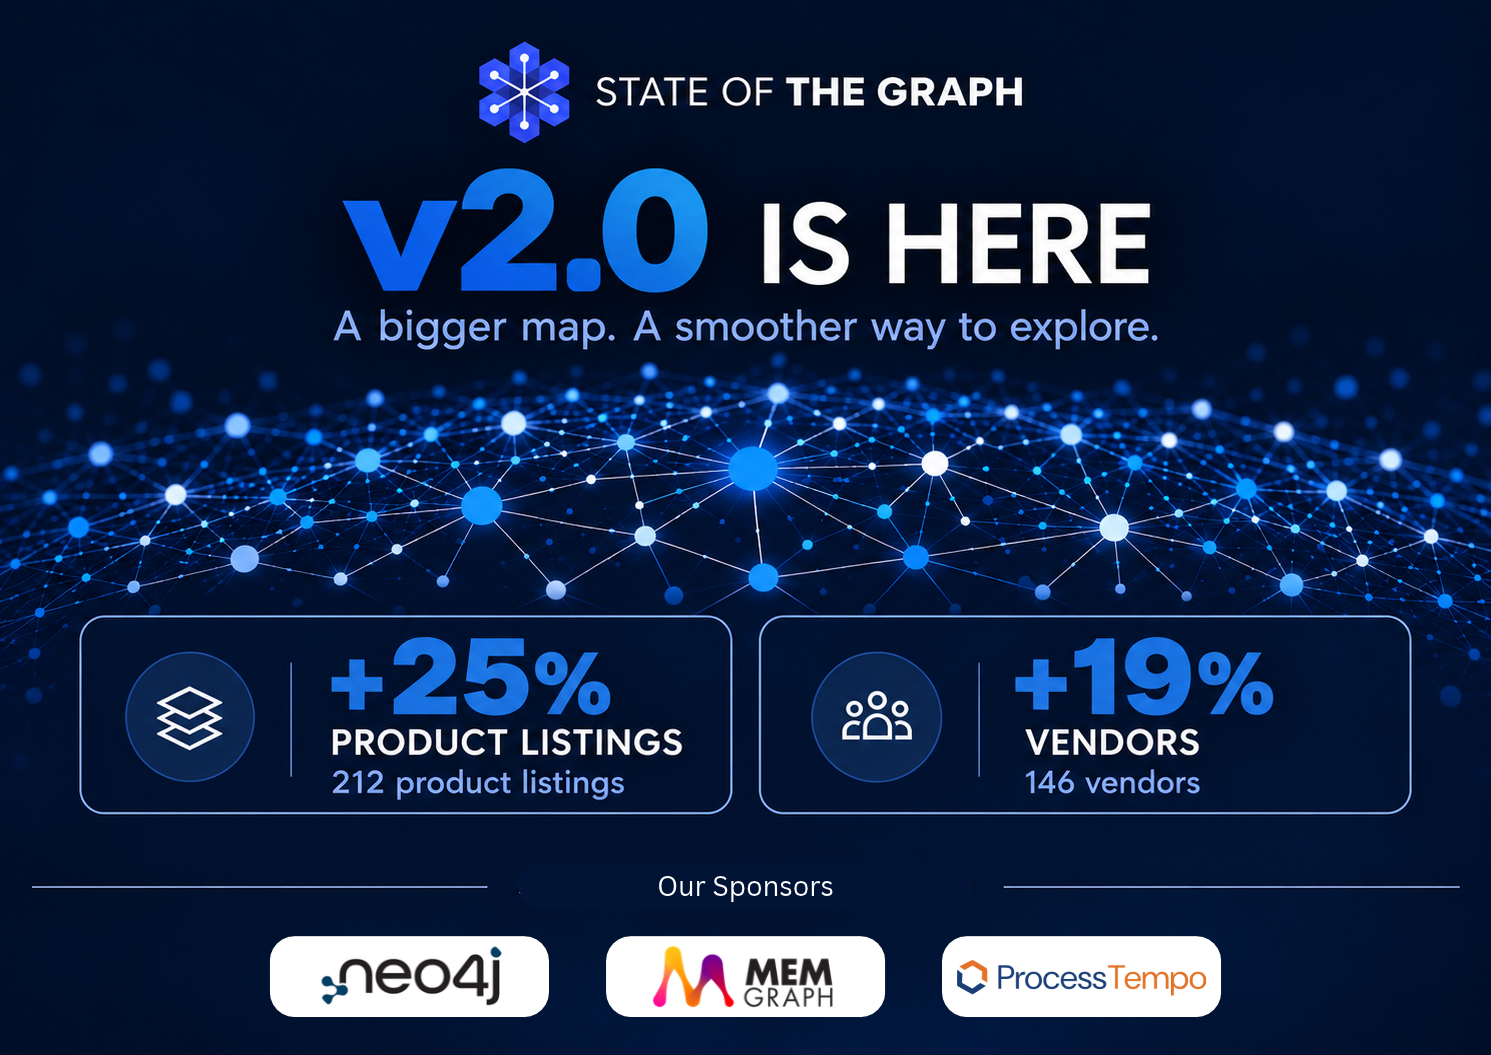
Today, we are releasing State of the Graph 2026 v.2.0. The map now tracks 212 catalog listings covering 172 unique products from 146 vendors. That’s 25% more listings than the completed June catalog.
The seven continents are the same. The terrain is not.
Every product on the map earned its place the same way: it passed three eligibility criteria for its category, checked against public product documentation.
Diligence and transparency drive growth and trust, and this is what matters most for the audience State of the Graph was created to serve.
- Tech professionals exploring graph tools, platforms, and architectures for real-world use cases.
- Analysts and investors tracking market trends and emerging categories in graph technology.
- Vendors and builders seeking a clear, inclusive map to position their innovations.
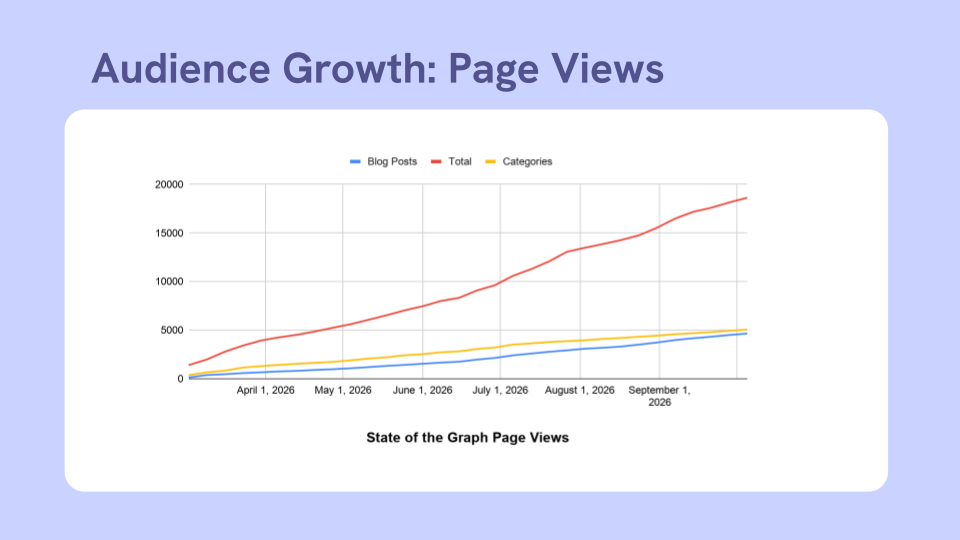
The audience is growing alongside the utility of graph technology and the trust in this work.
We are thankful to the first sponsors who support this work: Neo4j, Memgraph, and Process Tempo. We see this as validation of our work, and remain committed to diligence and transparency. Sponsorship plays no part in what is listed or how it is evaluated.
The growth is the headline, but not the story. The story is what the data shows about where graph technology is heading: two forces reshaping the market, three ways the market is responding, and a gap behind every one of them.
What changed since June 2026
The map grew by a quarter in four months, and the bar for inclusion went up.
| June 2026 | November 2026 | Change | |
| Continents (categories) | 7 | 7 | No change |
| Catalog listings | 170 | 212 | +42 (+25%) |
| Vendors | 123 | 146 | +23 (+19%) |
| Unique products | 172 | First like-for-like count |
June figures reflect the completed June catalog.
Seven continents, three layers. The Infrastructure layer (Graph Databases, Graph Engines) holds 66 listings. The Applied layer (Knowledge Graphs, GraphAI, Graph Analytics) holds 101. The Interaction layer (Graph Visualization, Graph Application Development) holds 45. Graph Databases is still the largest continent at 59 listings, and GraphAI is now second at 42.
Verification got stricter. Final verification checked every listing against its category’s three criteria and removed 19. The reasons repeated: a capability that wasn’t productized, no real graph role, a product no longer maintained, or a better fit on another continent.
Ontology tools moved to Knowledge Graphs. Previously, schema and vocabulary editors sat in Graph Application Development. They now sit in Knowledge Graphs, which covers two product types with their own criteria: 35 knowledge graph platforms and 14 ontology and schema modeling tools. Eight platforms qualify as both.
The overlaps grew. 28 products now qualify for more than one continent, and 37 vendors appear in more than one category, with 14 in three or more.
Continent by continent
Each continent tells its own story. Here is the headline from each, by layer.
| Continent | Listings | What stands out |
| Graph Databases | 59 | Property graph leads: 34 of 46 core databases. 16 of 46 are multi-model, adding graph to relational, document, or vector storage. |
| Graph Engines | 7 | All 7 query data where it already lives. None acts as the system of record. |
| Knowledge Graphs | 41 | 32 of 35 platforms are GenAI-native or RAG-ready. RDF leads, at 19 of 35. |
| GraphAI | 42 | All 29 GraphRAG and Graph Memory products are GenAI-native. None of the 13 GNN products are. |
| Graph Analytics | 18 | 13 of 14 core products expose a Python API. Not one supports RDF. |
| Graph Visualization | 28 | 16 of 28 work with any data model. Only 1 of 28 touches AI. |
| Graph Application Development | 17 | 14 of 17 are low-code or no-code. 12 of 17 work across multiple graph databases. |
What the data shows: two forces, three responses
In June, the map pointed to its boundaries: the products that cross from one continent to another. Four months later, the movement across those boundaries has a shape. Five trends show up on every continent. Two are forces reshaping the market. Three show how the market is responding. Each comes with a gap worth watching.
1. Agentic AI and GraphRAG
Agents are the first force, and every continent is reorganizing around them. All 29 GraphRAG and Graph Memory products are GenAI-native. 29 of 35 knowledge graph platforms support GraphRAG. Graph Memory, where a graph holds an agent’s long-term memory, now has 5 products that pass all three of its criteria, and 4 of those 5 appear on no other continent. They are not graph companies. They are agent companies with a graph at the core.
What to watch: trust. Grounding is common. Checking is not. Only 2 of 29 GraphRAG products document a full trust stack: provenance, lineage, policy enforced at answer time, and a step that checks an answer or refuses to give one. Among knowledge graphs, 7 of 35 document a check-or-refuse step.
2. Zero-ETL: graph goes to the data
The second force is architectural. All 7 graph engines query data where it already lives, and 4 run on Snowflake or cloud data warehouses. Graph analytics is moving into warehouse and lakehouse platforms too. Adding graph to existing data is becoming an alternative to moving data into a graph.
What to watch: RDF. Zero-ETL is a property graph story so far. No graph engine and no analytics product supports RDF.
3. Platform convergence
The borders between continents are blurring. 37 of 146 vendors span more than one category, and 16 of 46 core graph databases are multi-model. Eight of the 10 vendors in exactly three categories sit in the same stack: Databases, Knowledge Graphs, and GraphAI. Consolidation shows up in the data too: the catalog records seven acquisitions and mergers among listed products.
What to watch: full coverage. Only one vendor spans all 7 categories. Every other vendor is in 5 or fewer.
4. Low-code expansion
Building graph applications is moving beyond graph specialists. 14 of 17 graph application development tools are low-code or no-code, and packaged workbenches now sit beside the builders. The app layer is also separating from the database: 12 of 17 work across multiple graph databases, so teams can choose the two independently.
What to watch: ready-made apps. Graph applications that business users can run without building anything are still rare. Most graph tools still assume someone will build the application first.
5. Property graph and RDF convergence
The two data models still split by category. RDF leads knowledge graphs, at 54% of platforms. Property graph leads graph databases, at 70% of core products. Graph Application Development is where they meet most: 4 of 17 tools support both models.
What to watch: convergence at the core. The meeting happens mostly in the tools built on top. Underneath, it’s still rare: only 2 of 46 core graph databases and 4 of 35 knowledge graph platforms support both models.
What practitioners get from the map
State of the Graph is built for the people who have to choose, build, and justify graph technology. Here is what the map gives them.
• A shortlist that starts from the problem. Pick the continent that matches the job, whether that is storing a graph, grounding an LLM, or putting graph in front of business users, and see every product that qualifies.
• Products that are real. Every listing passed its category’s criteria against public documentation. Demos, archived projects, and features that exist only in marketing don’t make it on.
• Like-for-like comparison. Each category tracks the same features for every product, more than 100 across the map, so products can be compared on the dimensions that matter for that category.
• The overlaps, made visible. 28 products play more than one role. The map shows where a single product covers several jobs and where it takes several products to do one.
• A view that keeps up. The map is updated as products launch, change, or fall away, so a decision made today reflects the market as it is now, not as it was a year ago.
• The gaps, not just the trends. Each trend comes with what to watch, so teams can see where the market hasn’t caught up yet before they commit.
• No pay-to-play. Inclusion depends only on the criteria. No vendor pays to be listed or to be evaluated differently.
The map works for the other two audiences too. For analysts and investors, it is a consistent base for tracking how categories shift from one release to the next. For vendors and builders, it is a place on the map where buyers already look.
A better way to explore the map
A bigger map is only useful if it is easy to get around. State of the Graph 2026 v.2.0 changes how the catalogs work, not just what is in them.
- Native tables. The catalogs are now built into the site, not embedded, so moving through a catalog feels like part of the page.
- Search and filter. Every catalog can be searched and filtered down to the products and features that matter.
- Fewer rough edges. Registered users now land where they expect and see what they should.
What comes next
In June, the advice was to watch the boundaries between continents. That is still where the movement is. Agents are crossing every one of them, graph is moving to where the data lives, and more vendors now span more than one continent.
The map doesn’t pick a product. It shows where to look.
See it live. State of the Graph presents a two-hour Masterclass at Connected Data London on November 11, walking through all seven continents, the criteria behind them, and the trends above.
Get listed. Not listed yet, or need to update an entry? Submit it through the listing form. Every submission is checked against the same criteria as every listing on the map.
Explore the map at stateofthegraph.com.
Four months in, the map is bigger, stricter, and more connected. The most interesting developments are still at the edges.