
Graph Visualization
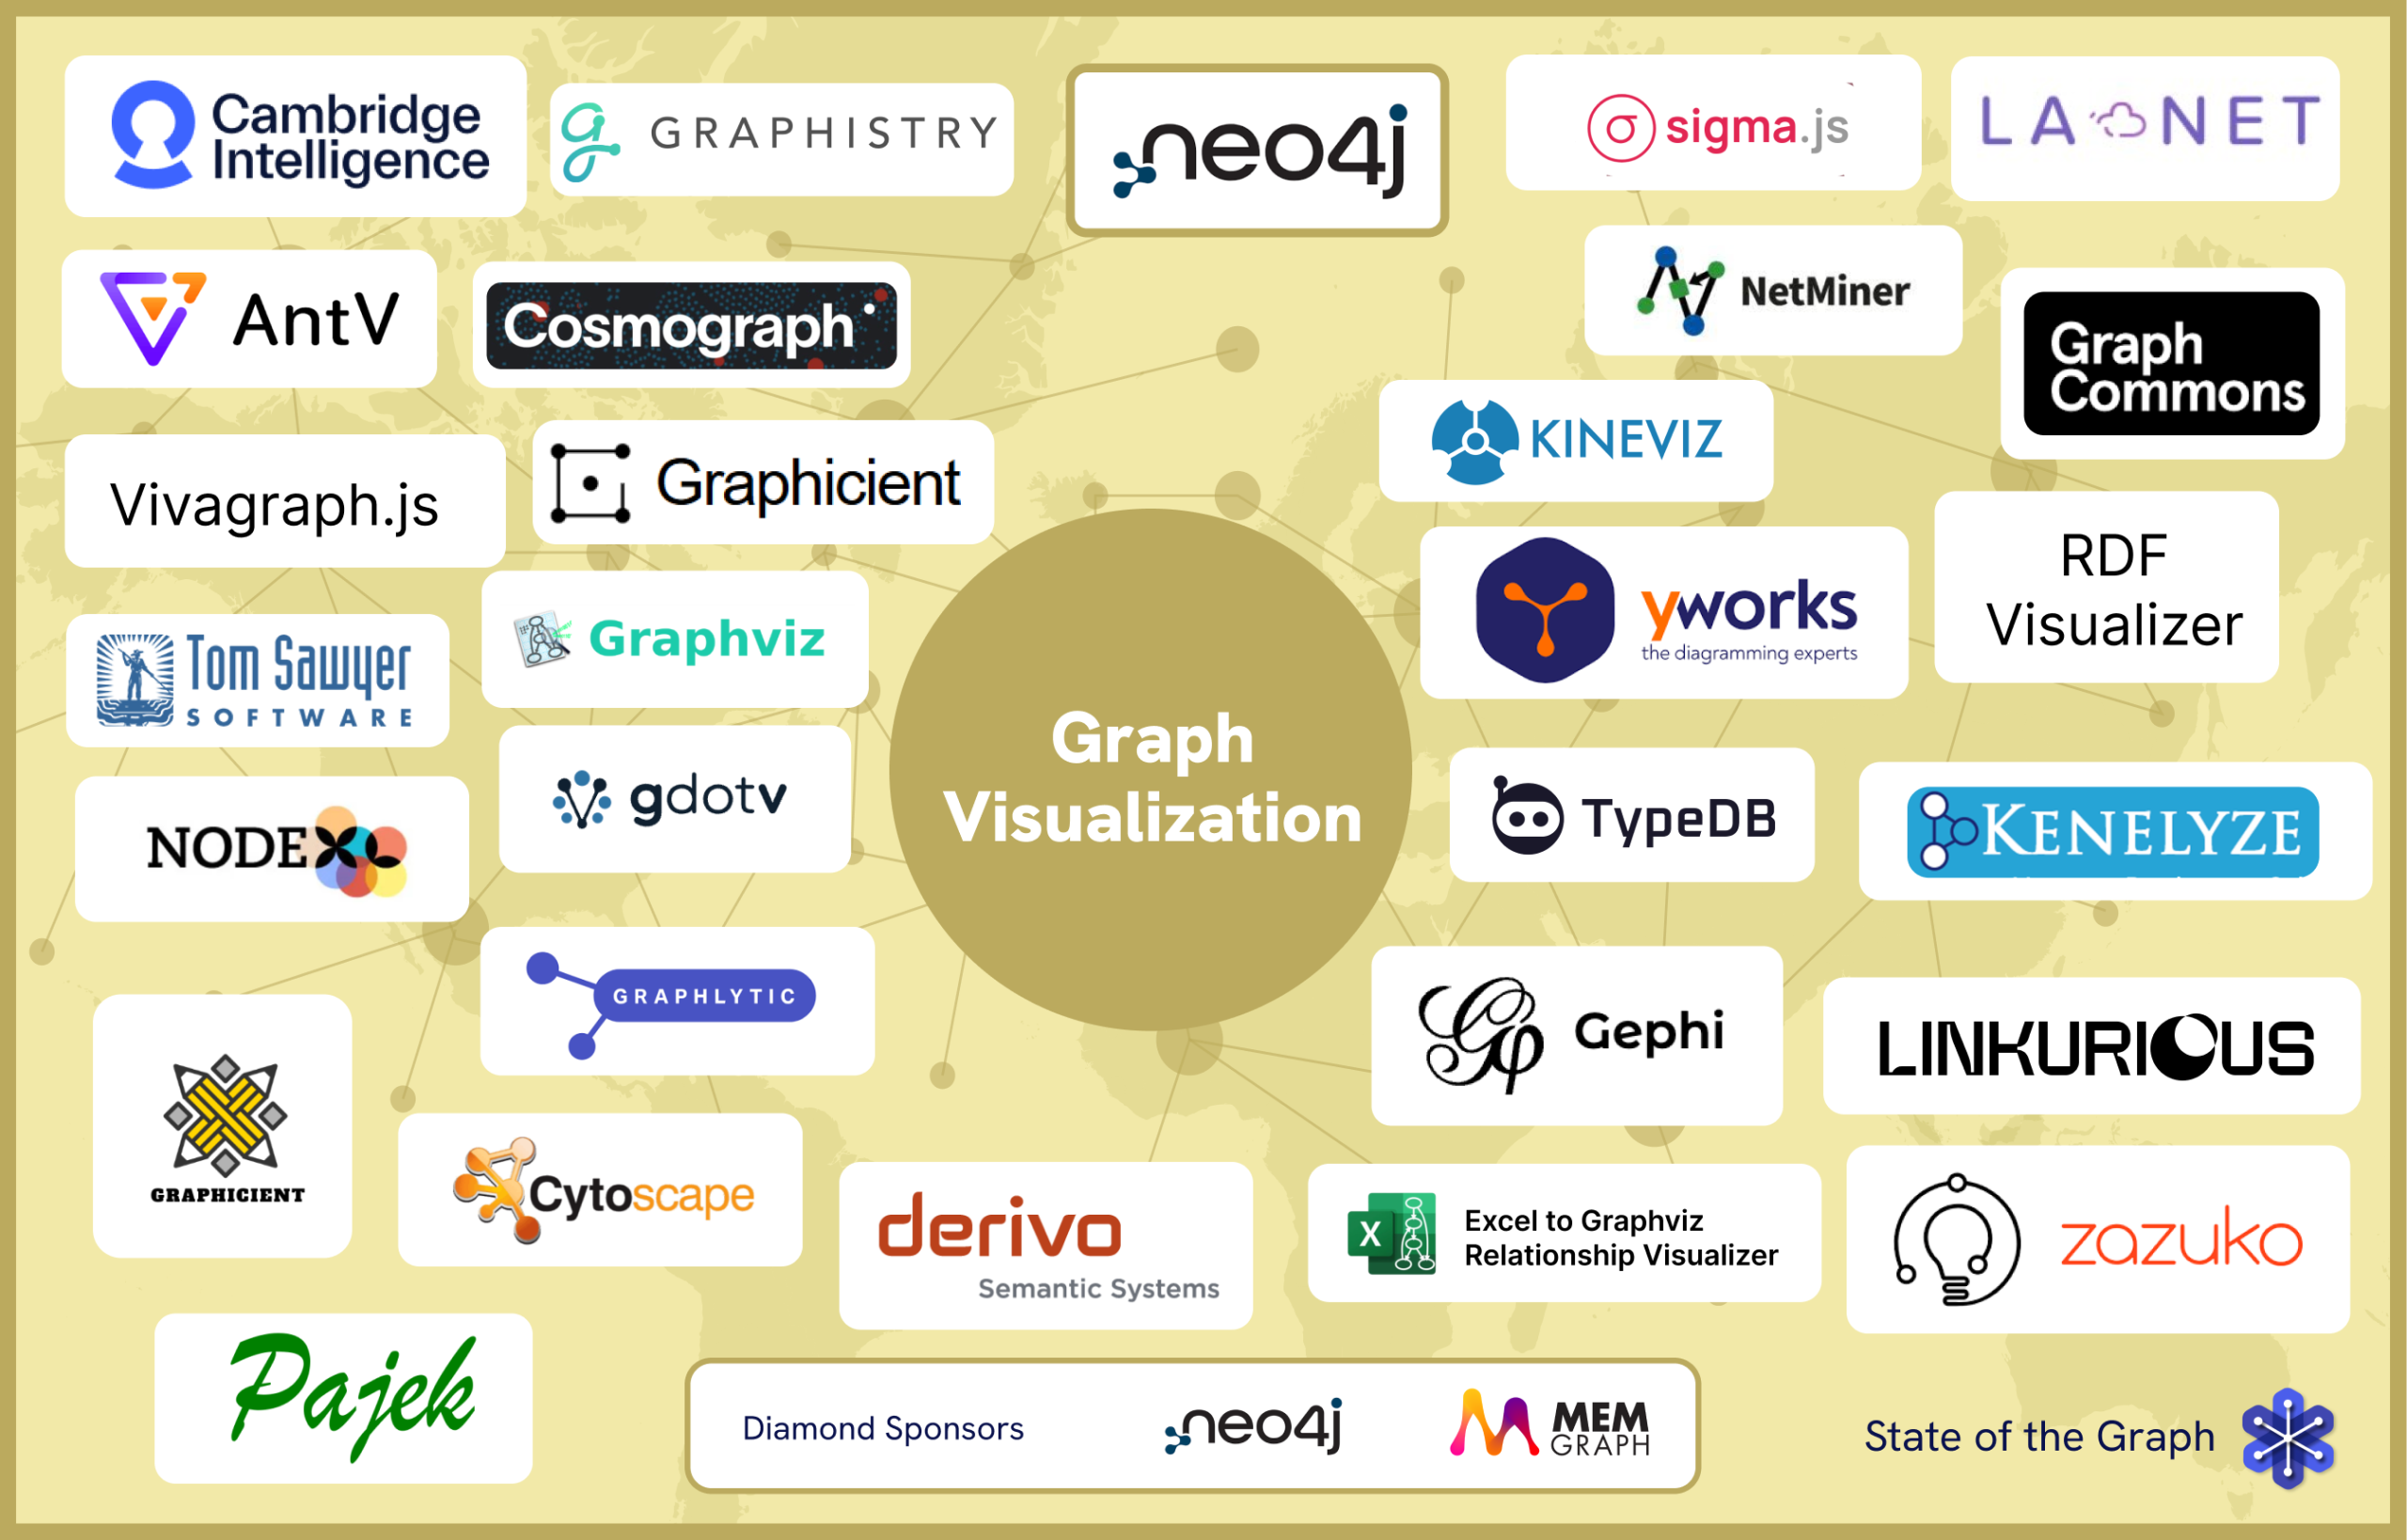
Graph Visualization tools render graph data visually, helping users explore connections and navigate complexity.
This catalog brings together tools whose primary purpose is interactive graph and network visualization, spanning analyst-oriented platforms and apps, classic desktop workbenches, and developer-focused libraries and SDKs that act as building blocks for custom graph experiences.
Our Sponsors
Memgraph
Diamond sponsor
Memgraph is a high-performance, in-memory graph database built for real-time AI context and graph analytics. It serves as the graph engine for GraphRAG pipelines, AI memory systems, and agentic workflows, delivering sub-millisecond multi-hop traversals with full provenance for systems that need structured, connected context alongside semantic search. The same architecture powers real-time graph analytics across fraud detection, network analysis, infrastructure monitoring, and other operational use cases.

Neo4j
Diamond sponsor
Neo4j is the knowledge layer for enterprise AI. Powered by the Neo4j Graph Intelligence Platform, Neo4j connects organizational data with humans and AI systems, surfacing not just relationships, but how and why they exist. The result is AI that is accurate, explainable, and governable. Built to integrate with everything. Proven by 84 of the Fortune 100 and supported by the world’s largest graph community, Neo4j helps organizations move AI from pilot to production.
To be included, an offering has to meet three criteria:
- Graph or network first: The product’s primary purpose includes interactive graph or network visualization (nodes and relationships), not only tables, standard charts, or dashboards..
- Standalone platform, app, or embeddable library/SDK: It is a usable platform, app, or reusable library/SDK that you can adopt directly in your stack, rather than a one-off screen or internal-only console.
- Actively maintained or widely used: It shows current product, documentation, or community activity, or, in the case of established tools, remains widely used and relevant today.
The table summarizes these tools across key dimensions, making it easier to shortlist options that match your graph visualization needs.
The dimension include product type, typical user, data input connectors, data models, layouts, scale band, built-in analytics, interaction depth, collaboration and sharing, embeddability, availability, and deployment.
Tech Professionals | Analysts and Investors | Vendors and Builders
Please note: You need to create an account in order to access this content
The table summarizes these tools across key dimensions so you can quickly see where each product fits and which merit a deeper look.