-
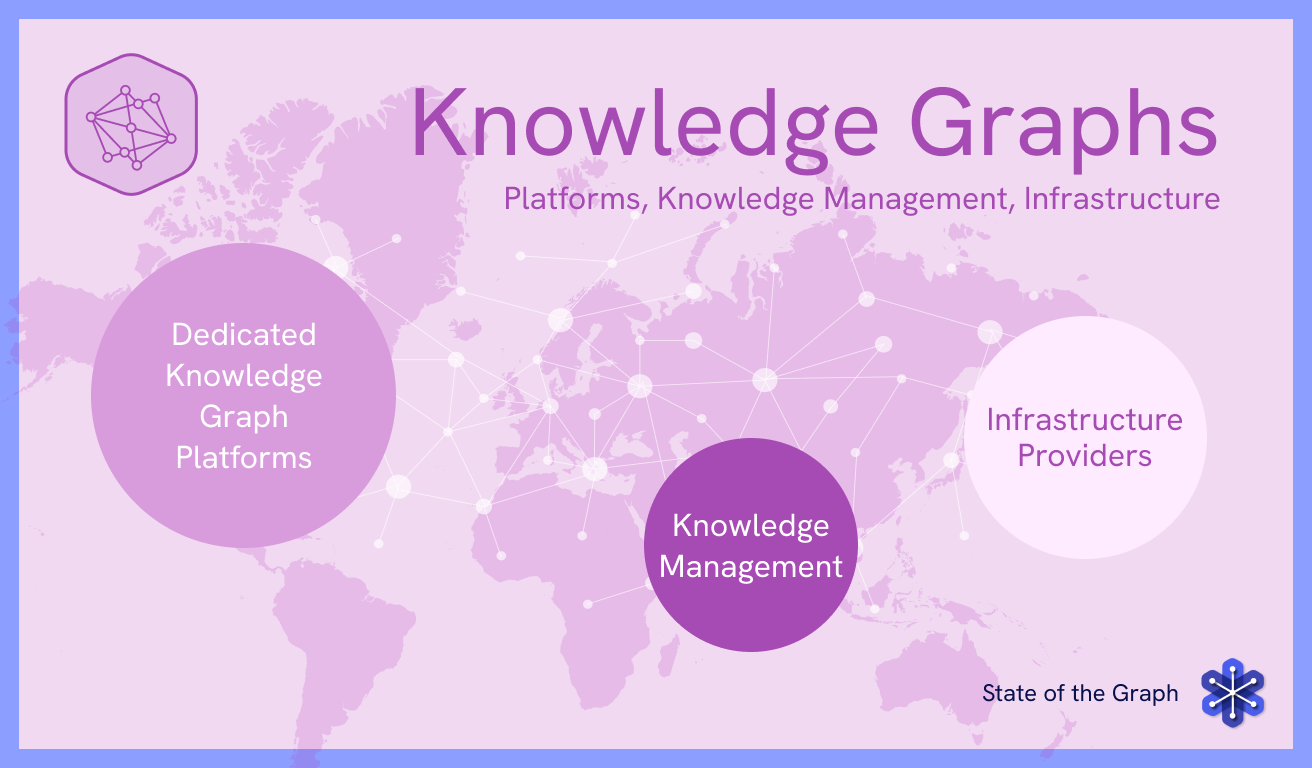
Mapping the Knowledge Graph Continent
•
State of the Graph is continuing its tour of the ecosystem with a first deep dive into the Knowledge Graphs category. Knowledge graphs organize information as a network of entities and relationships, often with semantic meaning, so systems can work with connected context rather than isolated records. The Knowledge Graph market is estimated to…
-
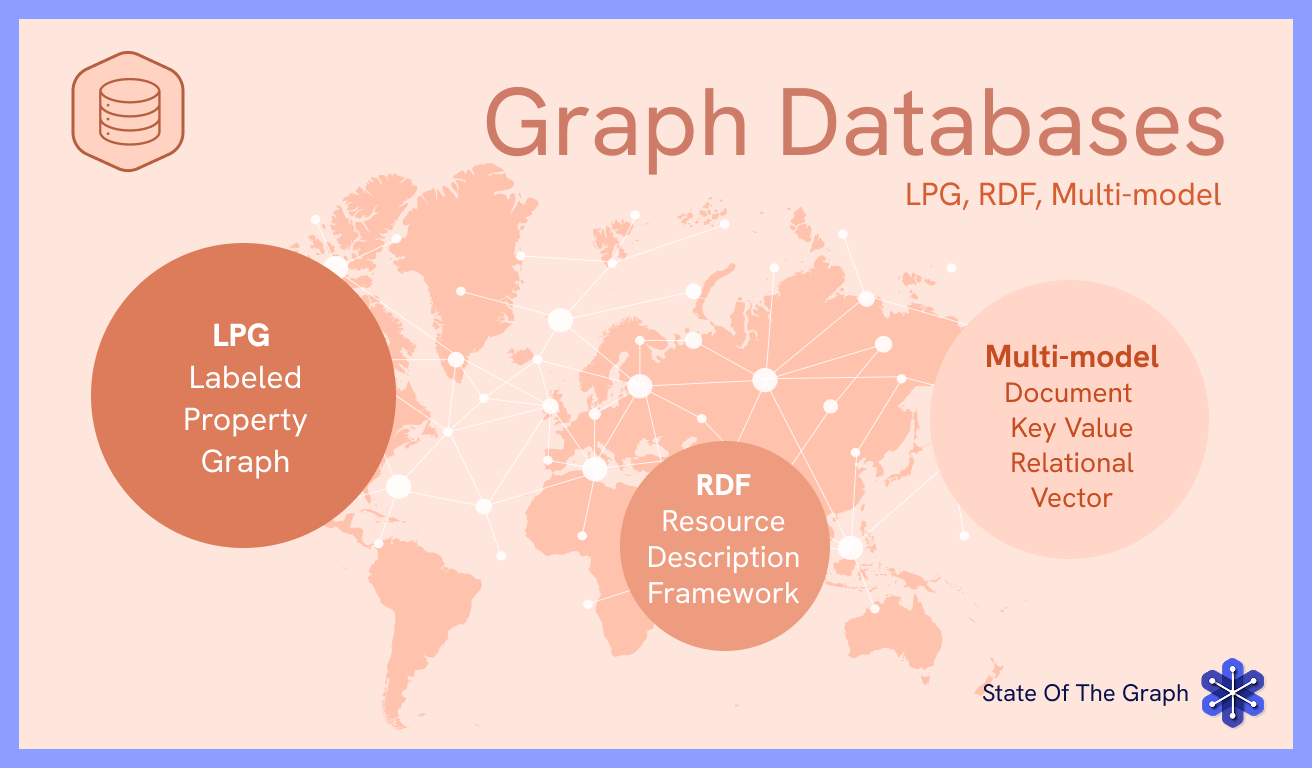
Exploring the Graph Database Landscape
•
State of the Graph is continuing its world tour with one of the most visible parts of the ecosystem: Graph Databases. Graph databases are where graph theory becomes a living system: a place to store, query, and analyze entities and their relationships at scale. They power use cases such as real‑time recommendations, fraud and…
-
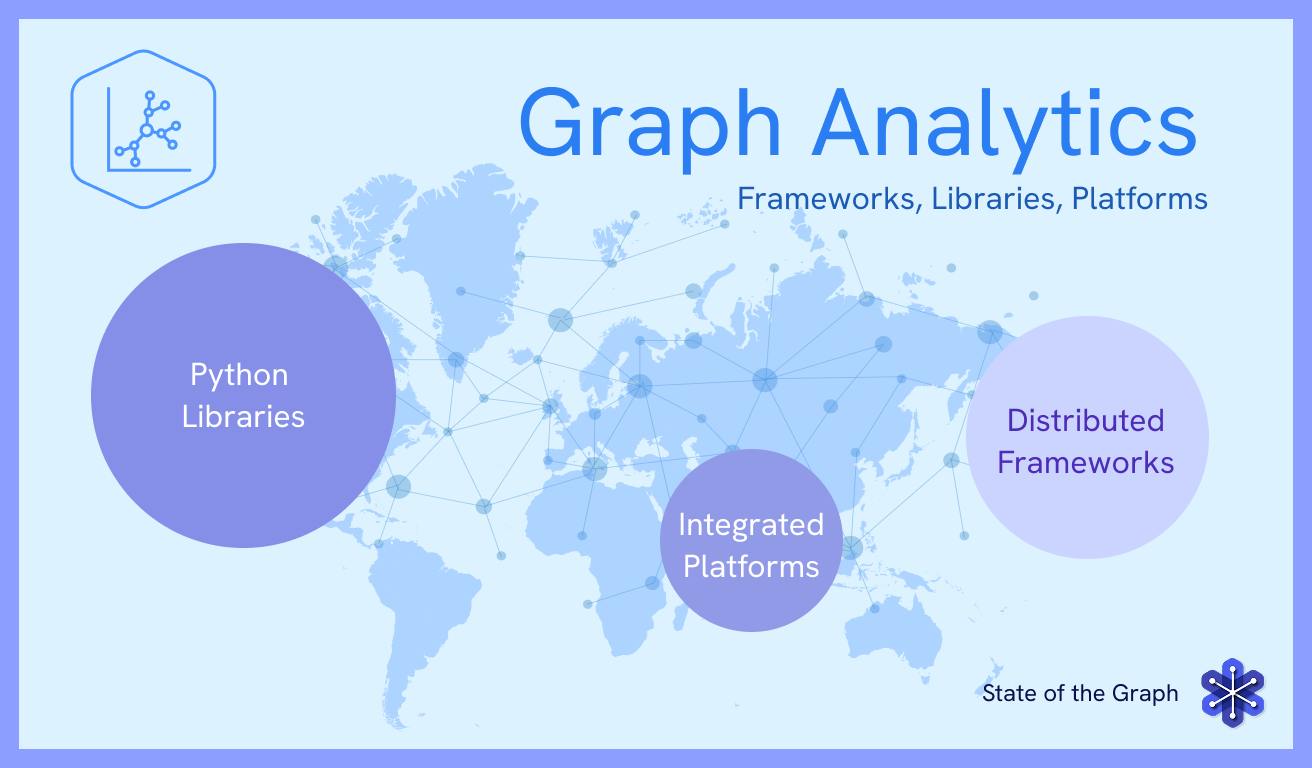
Navigating the Graph Analytics Map
•
State of the Graph is kicking off with its first published category: Graph Analytics. We navigate the Graph Analytics Map Graph analytics tools use graph queries and algorithms to uncover patterns and relationships in connected data, enabling use cases from network security and fraud detection to BI, retail, and social networks. Graph analytics sits…
-
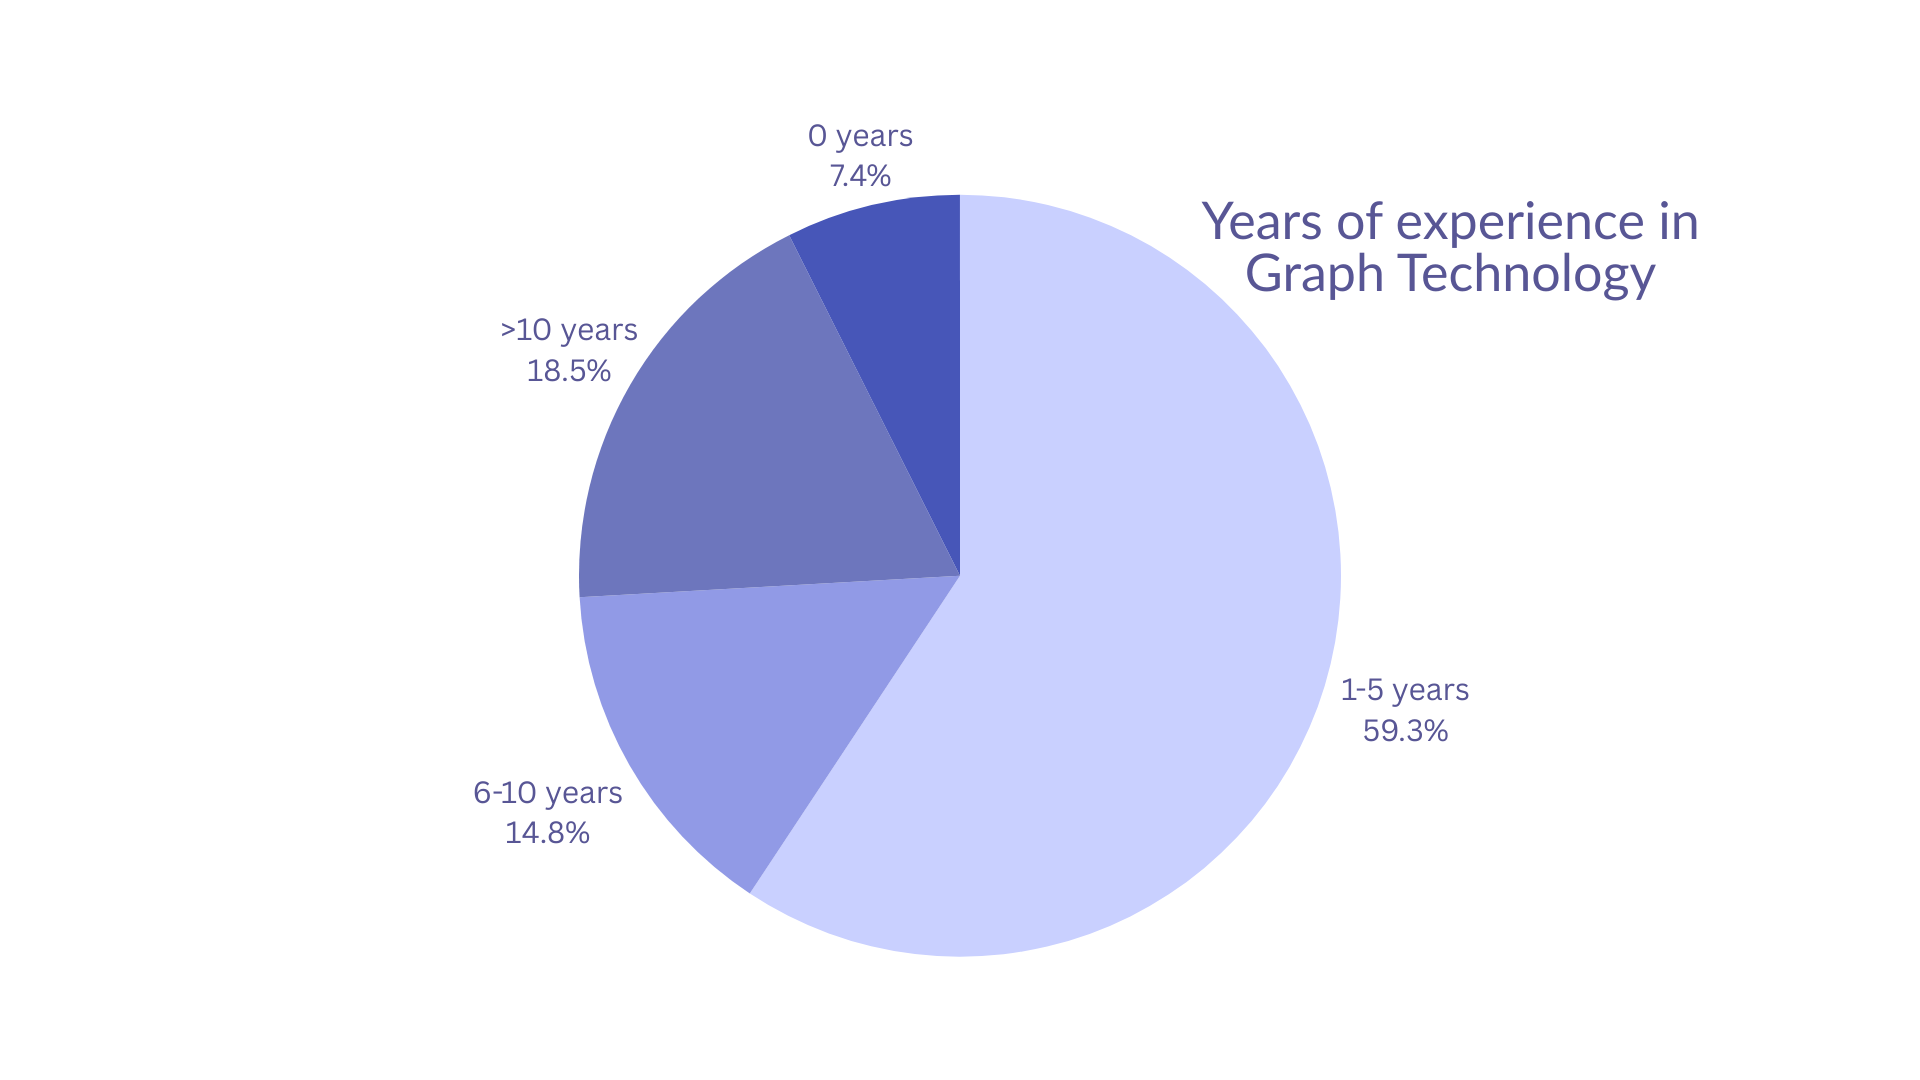
2025 State of the Graph Survey: Adoption and Gaps
•
Between November 2025 and January 2026, we conducted the first “State of the Graph” community survey to understand who is using graph technology today, how they use it, and where they need the most support. The early results point to a clear pattern: knowledge graphs and graph databases are driving adoption, but guidance and…
-
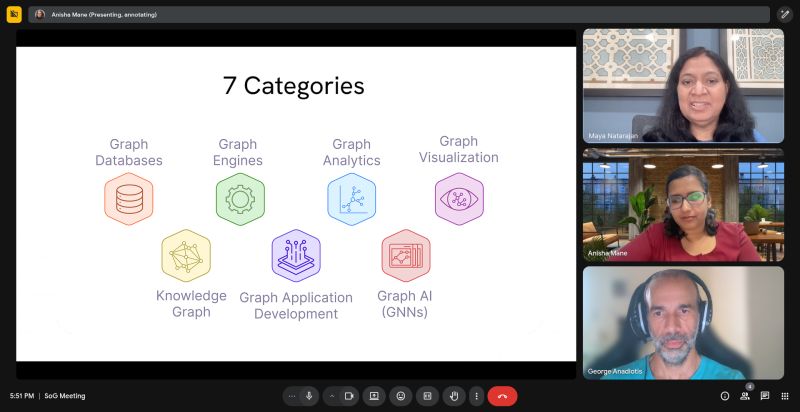
The 7 Continents of the Graph Stack
•
Graph technology has grown into a rich, multi-layered ecosystem, but the landscape can feel fragmented when trying to understand how all the pieces fit together. The State of the Graph organizes this complexity into seven clear categories, creating a shared map for anyone building, evaluating, or investing in graph-powered solutions. Why these 7 categories…
-
Introducing State of the Graph
•
Over the past two decades, graph technology has grown from a niche to a multibillion‑dollar market, accelerating in lockstep with AI. As the field expands, it’s getting harder to keep track of the full spectrum of vendors, categories, and innovations across the ecosystem. The State of the Graph exists to close that gap: a…