State of the Graph is kicking off with its first published category: Graph Analytics. We navigate the Graph Analytics Map
Graph analytics tools use graph queries and algorithms to uncover patterns and relationships in connected data, enabling use cases from network security and fraud detection to BI, retail, and social networks.
Graph analytics sits at a key intersection in the graph stack, where data platforms, algorithms, and applications come together to uncover influence, risk propagation, communities, paths, anomalies, and more. Accordingly, we limit this catalog to tools where graph algorithms are treated as core functionality, not as incidental add‑ons.
The tooling landscape can feel fragmented when you are trying to decide what to use, how to run it, and where each tool fits. The new Graph Analytics catalog is our first attempt to bring that space into a single, structured, vendor‑inclusive view, so you can see how frameworks, libraries, and platforms align with real‑world constraints.
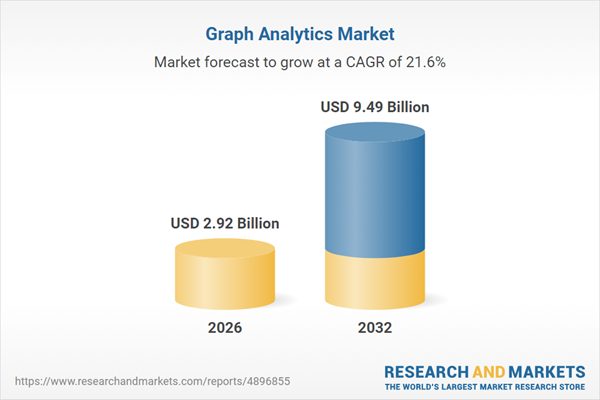
The Graph Analytics market size is projected to increase from USD 2.41 billion in 2025 to USD 2.92 billion by 2026, maintaining a compound annual growth rate (CAGR) of 21.61%. This trend indicates the market will reach USD 9.49 billion by 2032.
We start unveiling the State of the Graph’s comprehensive, up‑to‑date repository, visualization, and analysis of offerings across the graph technology space with Graph Analytics tools.
Our repository is organized into 7 categories. Each category has a definition and inclusion criteria that apply to both commercial products and open‑source projects. For each offering, we track a range of properties, from general information such as vendor and license details to domain‑specific features.
What We Included in Graph Analytics
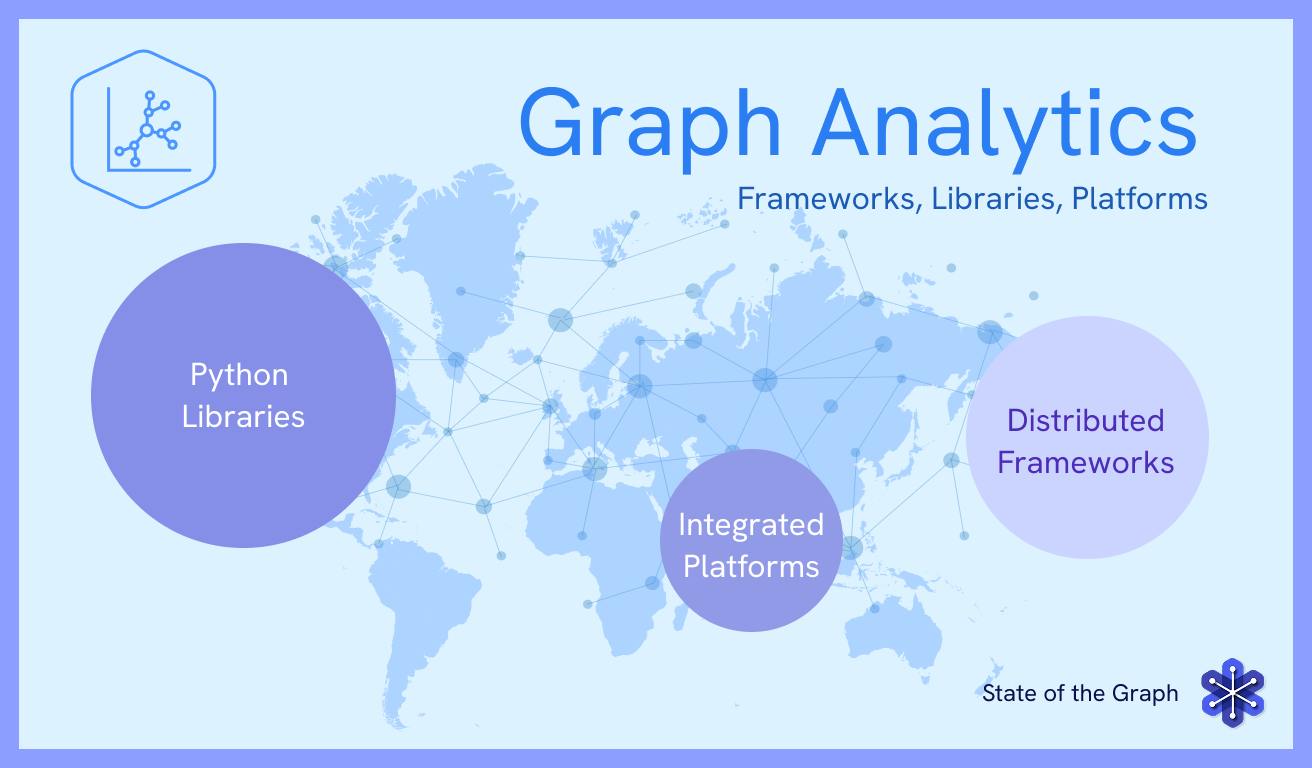
Our goal with this first version is not to be exhaustive, but to be clear. The catalog focuses on offerings where graph algorithms are the main event, not an afterthought, and it explicitly flags legacy and niche tools in the notes. You will see three broad types of entries:
- Distributed frameworks such as GraphFrames, and legacy engines like Flink Gelly and GraphX now listed separately in the catalog’s legacy section.
- Python libraries such as NetworkX, cuGraph, SNAP, and pathpyG, as well as niche, research‑oriented tools like NEExT, which are central to many data science and research workflows.
- Integrated platforms such as Neo4j Graph Data Science and Pometry, which combine algorithms with storage, visualization, temporal analysis, or Graph AI capabilities.
Within each row, we capture how the offering is coupled to backends, how it is deployed, which languages it favors, and which algorithms and data sources it supports. The intent is to let you quickly answer questions like:
- What can I use if I am already a Spark shop?
- Which tools make good use of GPUs for large graphs?
- Where do I go if I care about temporal patterns over evolving networks?
Inclusion Criteria: What This Catalog Is (and Is Not)
To keep the scope coherent, we defined three inclusion criteria and applied them consistently. An offering belongs in the Graph Analytics catalog only if it satisfies all three.
- Analytics as a Distinct Offering or Library
Graph algorithms must be offered as a standalone analytics product, module, or library, not just as features within a general‑purpose database or platform.
In practice, that means:
– there is a clear entry point for the analytics capability, such as a named module, library, or product area.
– the offering is intended to be chosen for its graph analytics functionality, rather than for the underlying database.
This is why, for example, we include tools like Neo4j Graph Data Science or an independent Python library, but do not list every graph database that ships a handful of built‑in algorithms as part of its core product. - Analytics First Class
Graph algorithms must be core capabilities, not something you are expected to hand‑roll from scratch.
Concretely, this means:
– algorithms are provided as built‑in APIs, procedures, or libraries.
– you can call an implementation of PageRank, Centrality, Community Detection, Shortest Paths, Embeddings, and so on, without re‑implementing every detail yourself.
This criterion draws a line between structured analytics offerings and ad hoc code snippets, notebooks, or one‑off scripts. - Clear Deployment and Backend Scope
An offering also needs a clear story for how it runs and where it runs.
We capture:
– deployment: open source or commercial; SaaS, managed in the customer’s cloud, or self‑managed.
– backend scope: whether it operates as a multi‑backend library spanning multiple data sources, or as an analytics layer tightly coupled to a specific underlying platform.
This gives practitioners a way to filter by constraints they actually live with: “We are all‑in on Python,” “We must run in our own cloud,” or “We want something that sits on top of existing data lakes and streams.”
Offerings can be platforms, libraries, or frameworks, as long as they meet all three criteria.
What the First Version Tells Us
Even in this first iteration, a few patterns stand out:
Python is everywhere
Many of the most widely used graph analytics options present Python APIs, even when they are built on top of C, CUDA, or distributed engines under the hood.
There is a shared “table stakes” algorithm set
Across frameworks, libraries, and platforms, you see repeated coverage of PageRank, centrality measures, connected components, various shortest‑path algorithms, clustering, and community detection.
Specialization is emerging
Some tools push deep into GPU acceleration and large‑scale performance, while others specialize in temporal networks, embeddings, or tight integration with particular data ecosystems.
This is the kind of signal we want State of the Graph to surface: not just who exists, but how the landscape is evolving and where capabilities cluster.
How This Fits into the State of the Graph
Graph Analytics is the first category we are publishing in detail, but it is only one “continent” in the broader State of the Graph map. Alongside it, we are building out structured views of:
- Graph databases
- Graph engines
- Graph visualization
- Knowledge graphs
- Graph application development
- Graph AI
Each category will follow a similar pattern: clear definitions, explicit inclusion criteria, and neutral coverage that reflects how the community actually uses graph technology.
The Graph Analytics catalog is our first test of that approach in the wild.
Help Us Pressure‑Test This First Version
This catalog is the first version, not a finished product. It is incomplete. Some lines between categories are fuzzy. We almost certainly missed tools and misclassified a few entries, and we are aware of that.
We are publishing early so that the graph community can help pressure‑test and improve the map:
- What is missing?
- What did we misclassify?
- Which tools are you actually using in production for graph analytics?
- Where do the criteria feel right, and where do they need refinement?
If you are choosing, building, or using graph analytics as an engineer, data scientist, architect, product owner, or technology leader, or if you are a graph analytics tool builder or vendor, we would love your help pressure testing this first version.
Check out the Graph Analytics catalog and tell us what we should add, fix, or clarify. Your input will help shape the next iteration of this category and the broader State of the Graph

Leave a Reply