Between November 2025 and January 2026, we conducted the first “State of the Graph” community survey to understand who is using graph technology today, how they use it, and where they need the most support.
The early results point to a clear pattern: knowledge graphs and graph databases are driving adoption, but guidance and training remain critical.
Who Responded to the Survey
Most respondents work in large organizations, with roughly six in ten coming from companies of 1,000 employees or more. The majority are based in North America and Europe and hold technical or adjacent roles, such as data engineers, solution architects, consultants, and product owners. Industries range from technology and financial services to healthcare, manufacturing, government, and retail, confirming that graph is now a truly cross‑sector capability.
Knowledge Graphs and Graph Databases Lead the Charge
Across all responses, two categories stand out: knowledge graphs and graph databases. A clear majority (close to 80%) of participants report using knowledge graphs and graph databases, making them the strongest entry points into the graph ecosystem today.
Many respondents also combine these with graph analytics, visualization, and, increasingly, graph AI, but those layers typically build on a foundation of data modeling and storage.
This aligns with what we see in the market: teams usually start by modeling entities and relationships, stand up a graph database, and only then add analytics, applications, and AI on top.
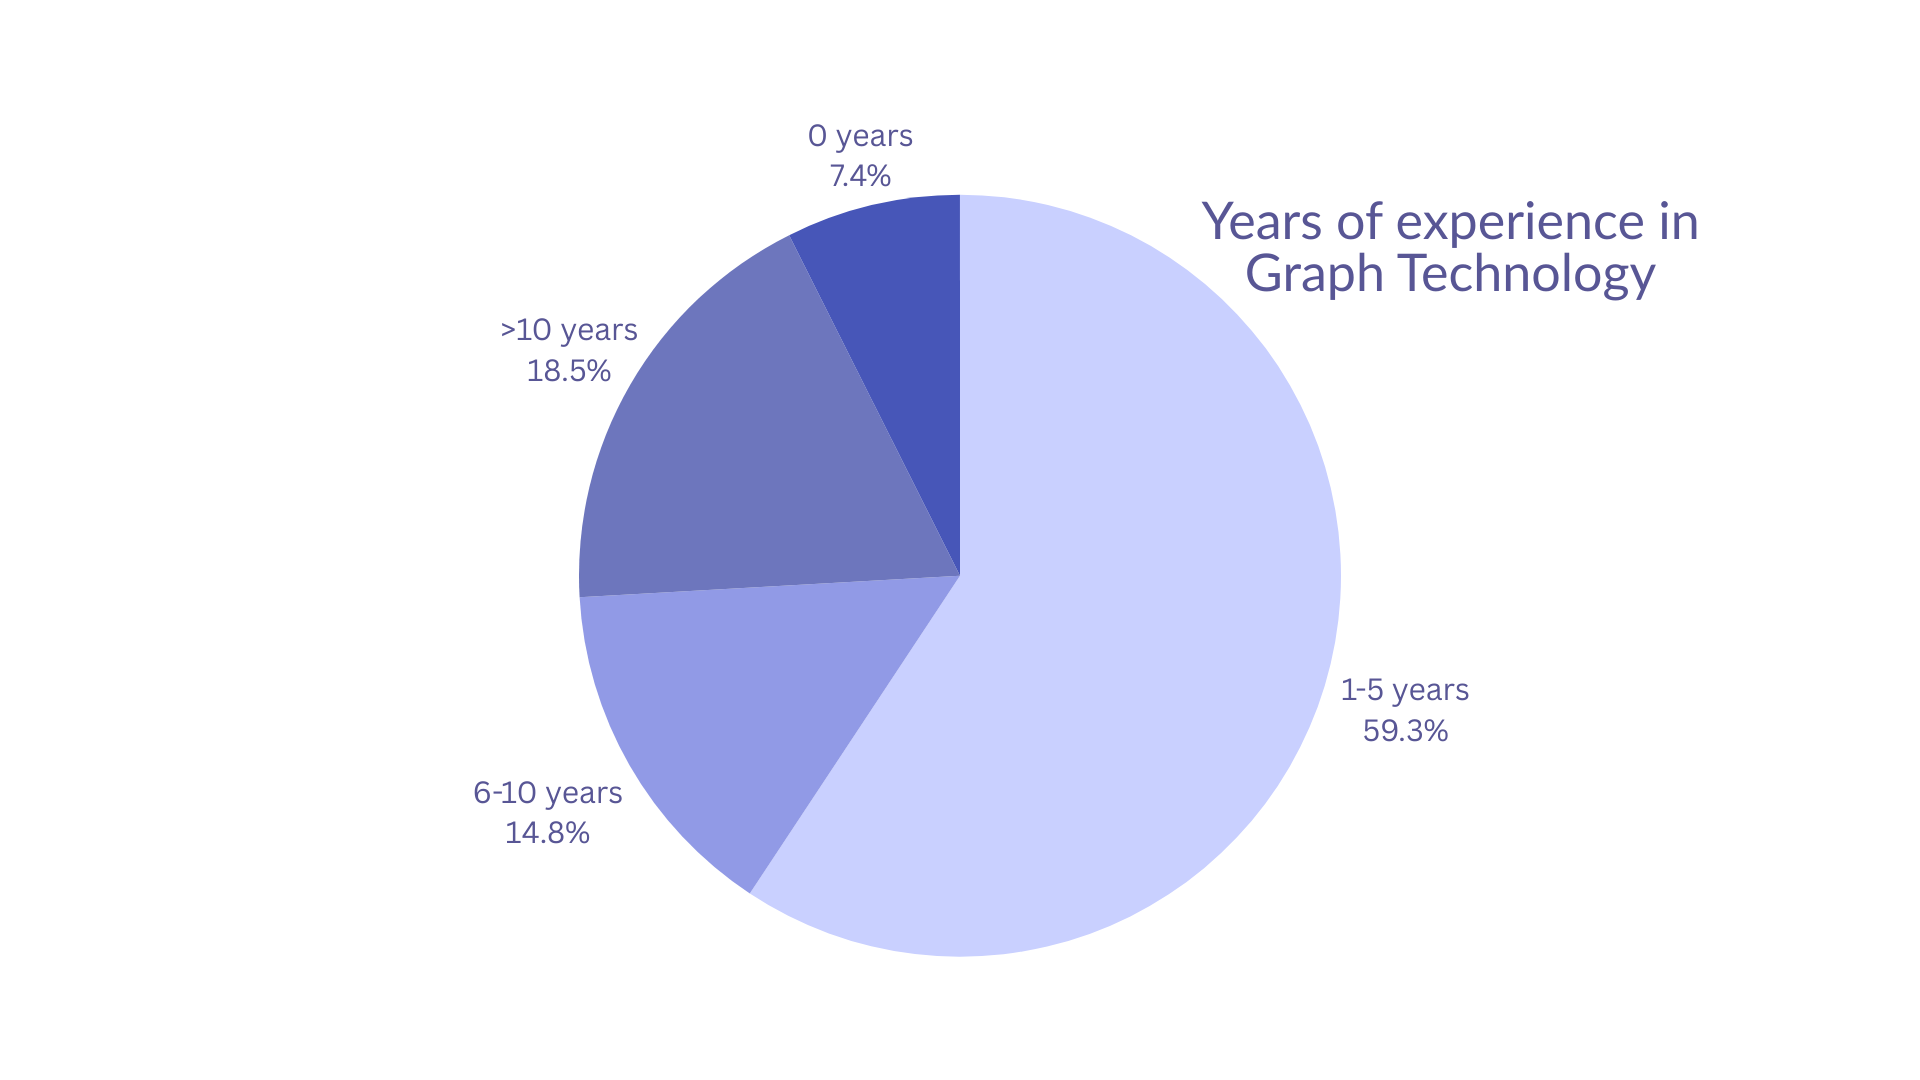
An Emerging Wave of Practitioners
Even in this first survey snapshot, experience levels tell an important story. Most respondents report 0–5 years of hands‑on graph experience, suggesting a growing influx of new practitioners rather than a long‑established expert community.
That pattern mirrors what we see across the industry: even senior leaders often come from broader data or software backgrounds and are still early in their graph journey. It creates both opportunity and risk because organizations are investing in graph while many teams are still working out patterns, pitfalls, and best practices as they go.
What the Community Says It Needs Next
Taken together, the responses highlight three recurring needs.
- Training and skill‑building. New and intermediate users are looking for practical guidance on data modeling, technology choices, and how to connect graph work to real use cases.
- Clearer navigation of the vendor landscape. With many tools touching graphs, from databases and engines to analytics, visualization, and AI, teams want help understanding where each fits.
- Actionable, vendor‑inclusive insight. Respondents value perspectives that cut across products and focus on patterns.
These needs map directly to why we’re building State of the Graph in three phases: an open repository of offerings, visual maps of the ecosystem, and deeper analysis for technology and investment decisions.
What’s Coming from State of the Graph
The survey results are already shaping our roadmap and content. In the near term, we’ll use this input to prioritize clear definitions and category boundaries across the graph stack.
This is only the first pulse check, and we plan to repeat and expand the survey as the ecosystem evolves.
If you want to stay close to future results, upcoming surveys, and new content, join the State of the Graph mailing list or follow us on LinkedIn.
📩 Join our mailing list: stateofthegraph.com
[in] Follow State of the Graph on LinkedIn
Leave a Reply