Graph technology has grown into a rich, multi-layered ecosystem, but the landscape can feel fragmented when trying to understand how all the pieces fit together.
The State of the Graph organizes this complexity into seven clear categories, creating a shared map for anyone building, evaluating, or investing in graph-powered solutions.
Why these 7 categories
Graph technology is no longer a single product type or niche toolset; it spans storage engines, analytics platforms, visualization tools, knowledge graphs, and AI systems that treat connections as first-class citizens.
To make this landscape understandable and navigable, State of the Graph groups offerings into seven high-level categories that reflect how teams adopt and apply graph capabilities in practice.
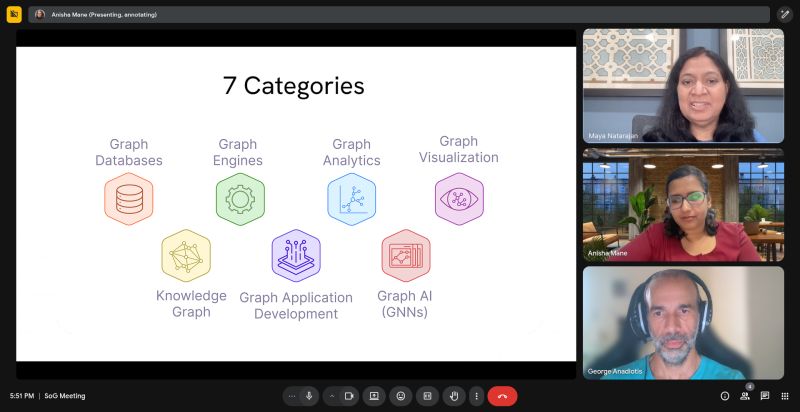
The 7 categories of graph
- Graph Databases
Graph databases are systems that store and query data natively as graphs, with nodes and relationships as first-class citizens. They provide models and query capabilities tailored for highly connected data, often powering use cases such as fraud detection, recommendations, and network analysis. - Graph Engines
Graph engines add graph functionality on top of existing data platforms such as relational, document, or lakehouse systems. These frameworks enable connected data analysis without requiring a full migration to a dedicated graph database, helping organizations bridge from legacy estates to graph-native architectures. - Graph Analytics
Graph analytics tools use graph queries and algorithms to uncover patterns, communities, paths, and anomalies in connected data. They help organizations see influence, risk propagation, bottlenecks, and other structural insights that remain invisible in traditional tabular analytics. - Graph Visualization
Graph visualization tools render graph data visually and interactively, making it easier to explore connections and navigate complexity. They often serve as the primary interface for analysts and business stakeholders to understand graph data structures, clusters, and relationships. - Knowledge Graphs
Knowledge graphs organize information into a network of entities and semantic relationships to provide deeper context. They are widely used to integrate heterogeneous data sources, support search and discovery, and ground AI systems in a consistent, explainable knowledge representation. - Graph Application Development
Graph application development platforms include IDEs, low-code/no-code environments that simplify the development and management of graph-powered applications. They streamline tasks such as schema design, query authoring, integration, and deployment so teams can focus on delivering value rather than stitching together tooling. - Graph AI
Graph AI systems apply machine learning, inference, and autonomous reasoning to graph-structured data. They provide capabilities such as entity resolution, predictive link analysis, intelligent routing, and context-aware agents by combining graph structure with advanced modeling techniques.
What comes next
Defining the categories is only the first step; each of these “continents” will be charted with detailed insights, vendor coverage, and visualizations that make the ecosystem easier to explore.
An upcoming blog will focus on Graph Analytics, examining how organizations use graph algorithms and queries to turn connected data into a competitive advantage.
Help shape the map of graph technology
These seven categories are intended to reflect how the community actually uses graph technology. Community input will help refine them and keep the State of the Graph accurate, comprehensive, and valuable for everyone.
Here’s how to get involved:
- Share your perspective on whether these categories resonate with your experience and what might be missing.
- Follow State of the Graph for upcoming deep dives into each category, starting with Graph Analytics.
- Connect with the team if you are building or evaluating graph technology and want to contribute insights or suggest offerings to include.

Leave a Reply